
In this section, a table is used to create exponential growth graphs. A calculator is helpful.
Refer to the previous section’s paper folding activity or repeat it.
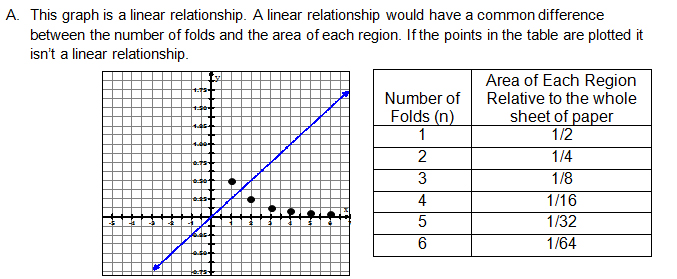
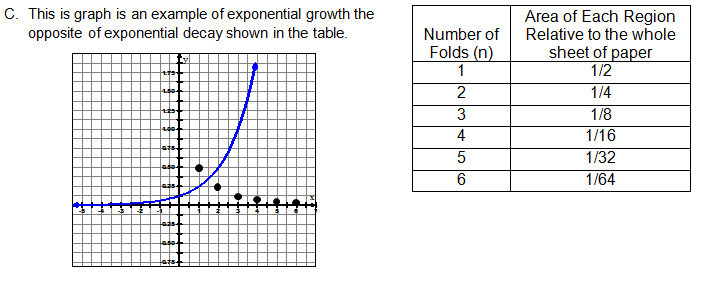
| Number of Folds (n) | Area of Each Region Relative to the whole sheet of paper |
| 1 | 1/2 |
| 2 | 1/4 |
| 3 | Interactive button. Assistance may be required. ____ 1/8 |
| 4 | Interactive button. Assistance may be required. ____ 1/16 |
| 5 | Interactive button. Assistance may be required. ____ 1/32 |
| 6 | Interactive button. Assistance may be required. ____ 1/64 |
The area of each region is Interactive button. Assistance may be required. ____ shrinking as the number of folds increases.
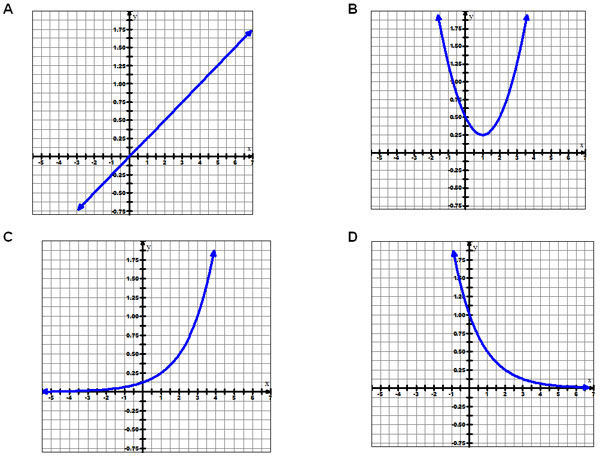
Review the following graphs. Select the one representing the relationship between the number of folds and Area of Each Region Relative to the whole sheet of paper. {Hint: Convert the 2nd column to decimals to match graphs.} After selecting the graph, read the descriptions of each graph below.
Interactive popup. Assistance may be required.

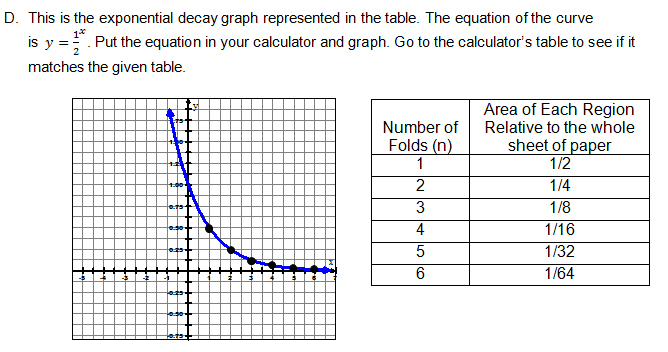
In this situation, where do you think the 1/2 comes from in the equation y = (1/2)x? Interactive button. Assistance may be required. ____ The area of each region is being cut in half .
The area of each region is Interactive button. Assistance may be required. ____ shrinking as the number of folds increases.

 Click here to see more exponential functions. Use the sliders to change the exponential functions and then look at the graphs created.