In this section, a table is used to create exponential growth graphs. A calculator is helpful.

  1. Fold a sheet of paper in half as many times as possible.
  2. After each fold, record the number of regions formed on the paper in the last column of the chart. Move your mouse over the blanks to reveal the answers.

Number of Folds (n)

Number of Regions Formed on the Paper

1

2

2

4

3

____

4

____

5

____

6

____

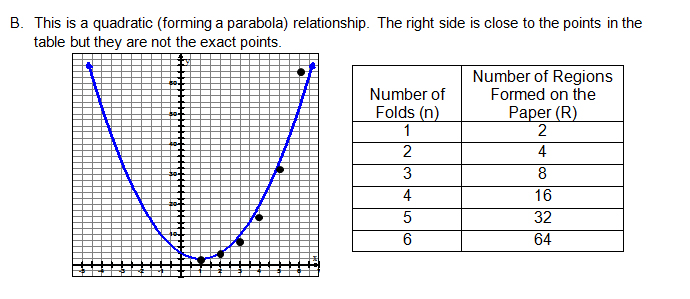
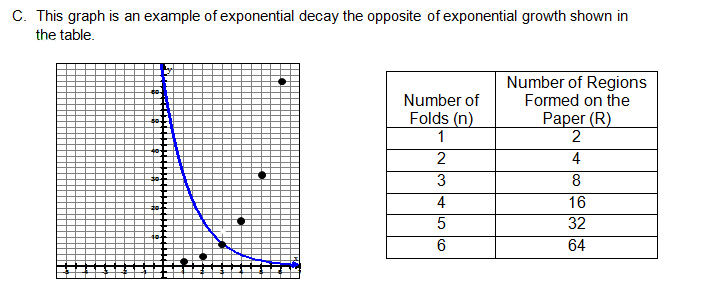
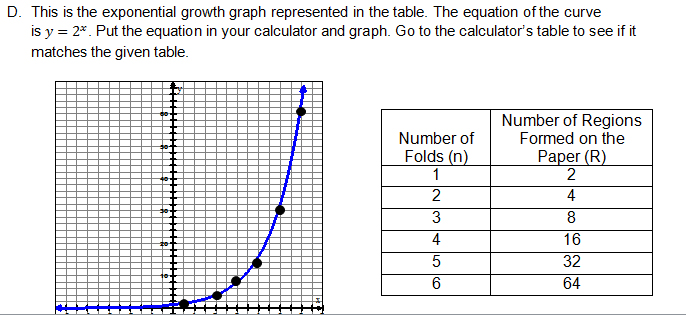
Review the following graphs. Select the one representing the relationship between the number of folds and the number of regions formed. After selecting the graph, read the descriptions of each graph below.

 A: Linear, B: Parabola, C: Exponential decay, D: Exponential growth

Interactive popup. Assistance may be required.

Click here for feedback for Answer A

Linear function doesn't match the table
Close Pop Up


Interactive popup. Assistance may be required.

Click here for feedback for Answer B

Quadratic function doesn't match the table
Close Pop Up


Interactive popup. Assistance may be required.

Click here for feedback for Answer C

Exponential decay - opposite of exponential decay
Close Pop Up


Interactive popup. Assistance may be required.

Click here for feedback for Answer D

Exponential growth representing the table
Close Pop Up

In this situation, where do you think the 2 comes from in the equation y = 2x? Interactive popup. Assistance may be required.

Click here for answer

The number of regions is doubling.
Close Pop Up