Many real world phenomena exhibit exponential growth and decay.
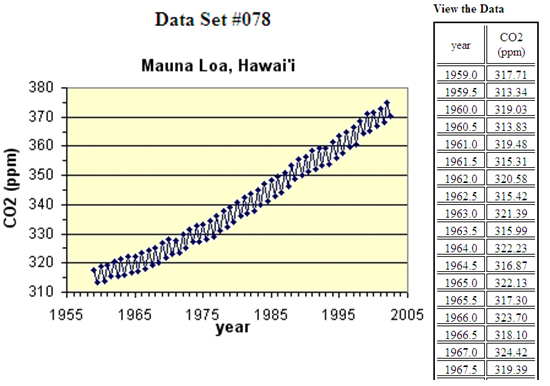
Below is an image of a graph and its associated data table. This represents a record of the amount of carbon dioxide pollution in the air for Mauna Loa, Hawaii, from 1955 to 2005. The amount of carbon dioxide (measured in parts per million) fluctuates, increasing during some years and decreasing during other years.
Based on the information provided by the graph and data set above, answer the following questions:
- Does this graph and table show exponential growth or decay?
Interactive popup. Assistance may be required.
Check Your Answer
- What does that tell you about the pollution over the years?
Interactive popup. Assistance may be required.
Check Your Answer
 The website linked below provides several real world examples of exponential growth and decay in the form of data sets.
Investigate the data sets and and their associated graphs more in depth by clicking the "Data Set" link left of the name of the study:
Exponential Growth and Decay Data
Below is a list of studies that reflect those found on the website. Which of the following studies' graphs and tables showed exponential growth? Which showed exponential decay?
- Spokane R. Trout Biometrics (#023)
Interactive popup. Assistance may be required.
Check Your Answer
- Earth’s Atmosphere: Pressure vs. Altitude (#024)
Interactive popup. Assistance may be required.
Check Your Answer
- Earth’s Atmosphere: Humidity vs. Temperature (#026)
Interactive popup. Assistance may be required.
Check Your Answer
- Swedish Agriculture Nitrogen Input vs. Time (#030)
Interactive popup. Assistance may be required.
Check Your Answer
- Cows and Fecal Coliform Water Contamination (#045)
Interactive popup. Assistance may be required.
Check Your Answer
- Tree Ring Widths in a Douglas Fir (#056)
Interactive popup. Assistance may be required.
Check Your Answer
- Raging River Discharge (#071)
Interactive popup. Assistance may be required.
Check Your Answer