Activity – Seesaw Experiment
This section is an activity providing an example of an inverse function graph. A graphing calculator is needed.
What happens when an adult and a small child sit on opposite ends of a seesaw?
Is it possible for the adult and child to seesaw successfully? Let’s make a simulated seesaw and examine the relationship.
 Click on the "go" button to begin the animation.
Copy and fill in the chart below on your own paper. When you are finished, you may move your mouse over the blanks to reveal the answers.
Reflect and Apply
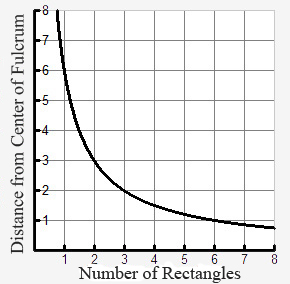
- As you increased the number of rectangles to the left side, what happened to their distance from the fulcrum?
Interactive popup. Assistance may be required.
Check Your Answer
- Multiply the number of rectangles and the distance from the fulcrum for each data set in the chart. What do you observe? What does this indicate?
Interactive popup. Assistance may be required.
Check Your Answer
- Use the STAT feature in your graphing calculator, plot the data from the left side where x is the number of rectangles and y is the distance from the center or fulcrum. Sketch the graph.
Interactive popup. Assistance may be required.
Check Your Answer
- An inverse variation is a function where one quantity increases while another quantity decreases. In the example, the number of rectangles on the left side __?__ and the distance from the fulcrum __?__. The product of the two quantities remains constant. The constant is labeled k.
Interactive popup. Assistance may be required.
Check Your Answer
- Find an equation for the graph.
Interactive popup. Assistance may be required.
Check Your Answer
The equation for an inverse variation is y =
six over x
6
x
or xy = 6, where k is a constant.