In this lesson, you studied inverse variation using tables as a representation. In the next few lessons, you will use graphs and algebraic methods (such as equations) to represent and analyze inverse variation situations.
Consider the two situations below.
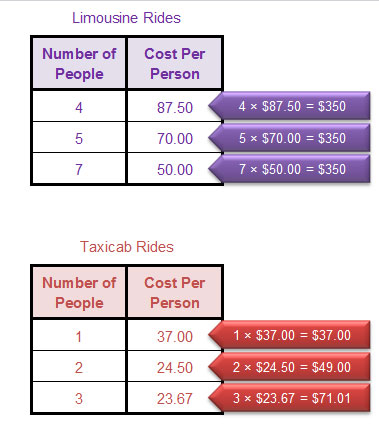
The situation that represents an inverse variation is the one with a constant of variation, k, that is equal to the product of the two variables for each pair of values.
In this case, the table of limousine rides is an inverse variation because the product of the number of people and the cost per person for each pair of data values is constant at $350.
However, the table of taxicab rides is not an inverse variation, because the product of the number of people and the cost per person for each pair of data values is not constant.