In this section, tables are analyzed to determine if they represent an inverse variation.
The table below represents a relationship that is an inverse variation. Multiply the values for x and y together in each column. Use the link beneath the table to check your answer.
| x | 2 | 3 | 4 |
|---|---|---|---|
| y | 6 | 4 | 3 |
 |
|
|
|
| Process | 2 × 6 = ___ | 3 × 4 = ___ | 4 × 3 = ___ |
Interactive popup. Assistance may be required.
2×6=12
Interactive popup. Assistance may be required.
The products are the same, and they are 12 each time.
The table below represents a relationship that is NOT an inverse variation. Multiply the values for x and y together in each column. Use the link beneath the table to check your answer.
| x | 2 | 3 | 4 |
|---|---|---|---|
| y | 4 | 6 | 8 |
|
|
|
|
| Process | 2 × 4 = ___ | 3 × 6 = ___ | 4 × 8 = ___ |
Interactive popup. Assistance may be required.
The products are different.
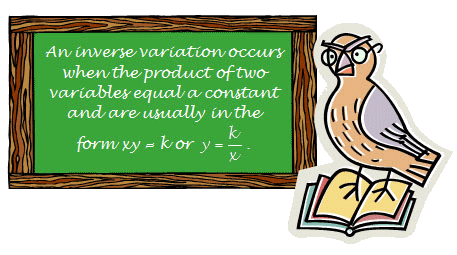
If a relationship between x and y is an inverse variation, what can you say about the product of each pair of numbers xy?
Interactive popup. Assistance may be required.
If a relationship is an inverse variation, the product xy will be the same for each pair of numbers x and y.
A constant product for an inverse variation is also called the constant of proportionality, k. How are k and the product xy related?
Interactive popup. Assistance may be required.
xy = k.
 Each of the tables below represents an inverse variation. Determine the constant of variation for each inverse variation, and drag the constant of variation, k, to the slot next to the appropriate table. Use the Reset button to reset the interactive if necessary. You may not use all of the numbers as possible values for k.
| x | y |
|---|---|
| 2 | |
| 10 | |
| 5 | 6 |
Interactive popup. Assistance may be required.
Use the known pair of values for x and y to determine k, the constant of variation.
Interactive popup. Assistance may be required.
| Table 1 | |
| x | y |
| 3 | 12 |
| 4 | 9 |
| 6 | 6 |
| 9 | 4 |
| Table 2 | |
| x | y |
| 3 | 8 |
| 4 | 6 |
| 5 | 5 |
| 6 | 4 |
| Table 3 | |
| x | y |
| 5 | 2.5 |
| 10 | 12.5 |
| 12 | 1.05 |
| 25 | 0.5 |
| Table 4 | |
| x | y |
| 2 | 4.8 |
| 3 | 3.2 |
| 4 | 2.4 |
| 6 | 1.6 |
Interactive popup. Assistance may be required.
An inverse variation relationship has a constant of proportionality, k, such that the product of xy for each pair of values for x and y is the same.
Interactive popup. Assistance may be required.
Table 1 (k = 36)