

View the steps to get this answer.

Which of the following graphs best represents the solution to the system of linear equations shown below?
x + 5y = −5
4x − 3y = −20
To use the calculator, we need the equations in slope-intercept form.
Copy the original problem down and solve for y in each equation in your notes.
What is x + 5y = −5 in slope-intercept form?
Interactive popup. Assistance may be required.
What is 4x − 3y = −20 in slope-intercept form?
Interactive popup. Assistance may be required.
Now you need to graph and match the correct answer choice.
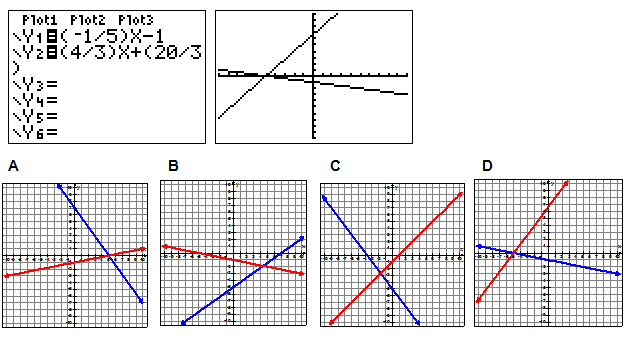
Looks like the answer might be D because it crosses on the x-axis between the 2nd and 3rd quadrants and none of the other graphs do.
Is there a way to check your work?
Which of the following graphs best represents the solution to the system of linear equations shown below?
x + 5y = −5
4x − 3y = −20
You think the answer is D. Where do the two lines intersect?
You can use TRACE to find the intersection.
Remember that the point ought to make true statements if you substitute into the equations. Move your mouse over the graph below to see the point.
If you need additional practice, click here for two additional problems to solve.