First, you’ll use an interactive applet to understand what it means to solve a system by graphing.
Before working with the applet, it will be helpful to understand what you’re looking at.
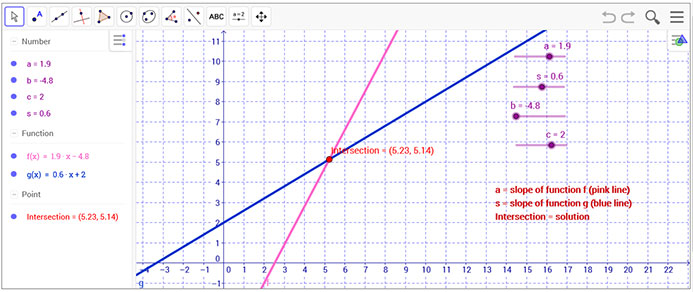
The equations in this applet are in slope intercept form, y = mx + b, the same form used on your calculator. On the applet, the first equation is the pink line and the second equation is the blue line.
The slopes for the lines are in the upper right hand corner. The slope for the pink line is a, and the slope for the blue line is s. Move the sliders a and s to observe the change in the slope.
The b in y = mx + b are b and c respectively.
The solution is the point of intersection.

 Solving Systems of Linear Equations
Practice by solving the following system of equations.
y = 3 over 5 3 5 x + 1
x − 2y = -3
First equation, the pink line:
Move a to 3 over 5 3 5 = 0.6 and b to 1.
Second equation, the blue line:
Rewrite the equation from standard form to slope intercept form.
x − 2y = -3
+2y +2y
x = 2y − 3
+3 +3
x 3 over 2 x + 3 2 = 2y over 2 2y 2
x over 2 x 2 + 1.5 = y
y = x over 2 x 2 + 1.5
Move s to 1 over 2 1 2 = 0.5 and c to 1.5.
The solution is the point of intersection. Find the solution.
Copy each system of equations below on your own paper.
Change the graphs to slope-intersept form. Remember, you need to be able to change the graphs to slope-intersept form to use the graphing calculator.
Sketch the graphs and try to determine where they cross. Don’t take a long time to do this. Just draw the axes, label each line, and label the point of intersection.
Which equations did you write for each system of equations in slope-intercept form? Check your equations here.

Now you are going to use the applet to solve each system of equations.
Solving Systems of Linear Equations
What answers did you get? (use your mouse to see the correct answers below.)
Did these answers match your sketches?