In this section, you are going to be solving linear inequalities by graphing.

Video segment. Assistance may be required. Watch the video below and then answer the questions that follow.

Source: Graphing Linear Inequalities , MrJSaintGermain, You Tube

Use your notes to answer the following questions.

  1. How do you determine whether to use a solid line or a dashed line?
  2. How do you determine which region of the graph to shade?
  3. Where are the solutions to an inequality found?
Interactive popup. Assistance may be required.

Check Your Answers

  1. If the inequality symbol is "less than" or "greater than" (< or >), a dashed line is used. If the "equal to" (≤ or ≥) is included in the inequality symbol, then a solid line is used.
  2. To determine which region of the graph to shade, you should choose a test point above or below the graphed line. If the chosen point solves the inequality, then shade the region of the graph where the chosen point is found. If the chosen point does NOT solve the inequality, then shade the other region of the graph.
  3. The solutions will be found in the shaded region and on the line itself if "equal to" is part of the inequality symbol.
Close Pop Up

You can always check solutions algebraically.


Example: Is (-2, 1) a solution to the inequality y ≥ 0.5x + 2?

y ≥ 0.5x + 2
1 ≥ 0.5(-2) + 2
1 ≥ -1 + 2
1 ≥ 1 Since 1 is greater than or equal to 1, (-2, 1) is a solution to the inequality.

In your notes, determine if (3, 6) is a solution to the inequality y ≥ 0.5x + 2?

Interactive popup. Assistance may be required.

Check Your Answers

y ≥ 0.5x + 2
6 ≥ 0.5(3) + 2
6 ≥ 1.5 + 2
6 ≥ 3.5 Since 6 is greater than 3.5, (3, 6) is a solution to the inequality. (If you look at the graph, you should notice that the point is in the shaded region.) Close Pop Up

Graph the solutions to the inequalities below on your own graph paper.

  1. y < x – 2
  2. y > 3x + 1
  3. yx + 4
  4. y ≤ -2x + 5
Interactive popup. Assistance may be required.

Check Your Answers

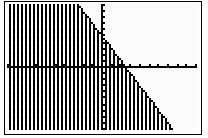
1. The graph is shaded below the dashed line.

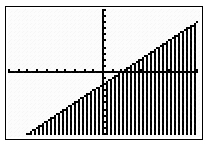
2. The graph is shaded above the dashed line.

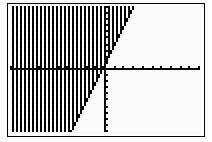
3. The graph is shaded above the solid line.

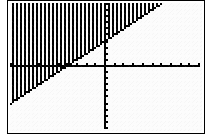
4. The graph is shaded below the solid line.

Close Pop Up