If the inequality is in standard form, how can you graph the inequality?
Why does the boundary line appear dashed when the inequality symbol is < or > and solid when the inequality symbols is ≤ or ≥?
When graphing one-variable inequalities on a number line, you used an open circle for inequalities containing < or > and a closed circle for inequalities containing ≤ or ≥. How is that similar to using a dashed or solid line for linear, two-variable inequalities?
You can also graph inequalities on a graphing calculator. View this link to learn more about how to graph inequalities on a graphing calculator.
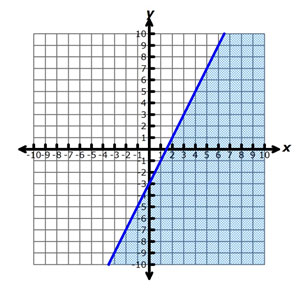
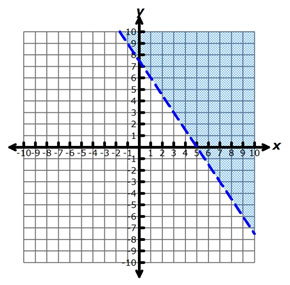
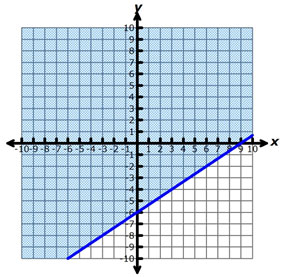
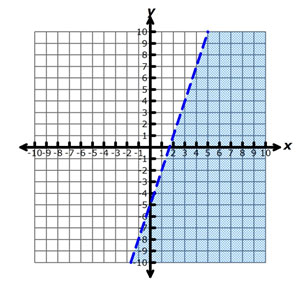
Graph each of the following inequalities.
Interactive popup. Assistance may be required.
What type of line should be graphed: solid or dashed? Which region of the graph should be shaded: above or below?Interactive popup. Assistance may be required.
Interactive popup. Assistance may be required.
What type of line should be graphed: solid or dashed? Which region of the graph should be shaded: above or below?Interactive popup. Assistance may be required.
Interactive popup. Assistance may be required.
What type of line should be graphed: solid or dashed? Which region of the graph should be shaded: above or below?Interactive popup. Assistance may be required.
Interactive popup. Assistance may be required.
What type of line should be graphed: solid or dashed? Which region of the graph should be shaded: above or below?Interactive popup. Assistance may be required.