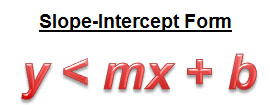
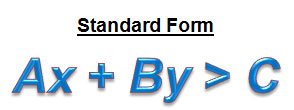
As with linear equations, linear inequalities can be represented in two forms.
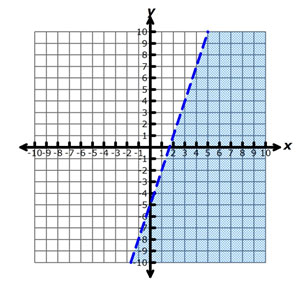
You can graph a linear inequality from either form, just as you can with linear equations. However, because an inequality has multiple solution possibilities, there are additional steps that need to be taken to completely graph a linear inequality.
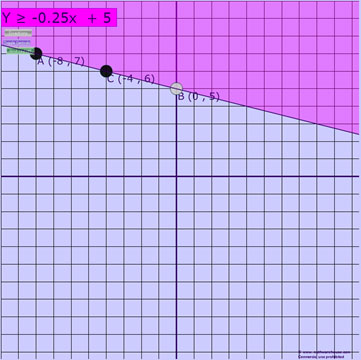

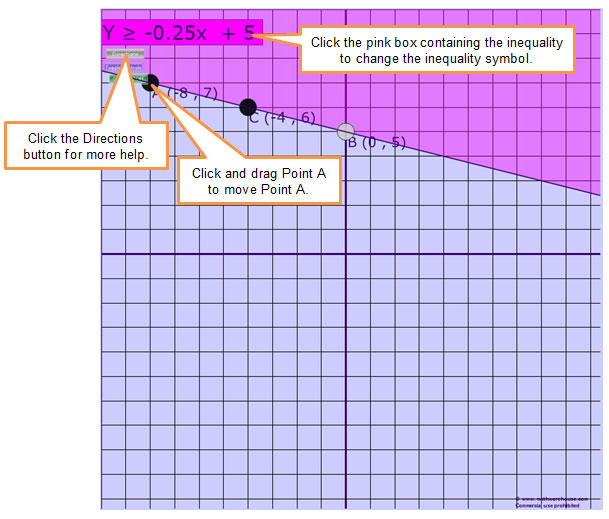
 Copy the table below into your notes. Use the inequality grapher to complete the table below. Click on the graph to access the applet. For directions on how to use the applet, click on the directions tab in the top left corner of the applet.
After completing the table, use the information contained in the table to answer the questions that follow.
| Point A | Point B | Inequality | Dashed or Solid Line? | Shading Above or Below? |
| (-8, 7) | (0, 5) | y ≥ -0.25x + 5 | Solid | Above |
| (-8, 7) | (0, 5) | y > -0.25x + 5 | ||
| (-8, 7) | (0, 5) | y < -0.25x + 5 | ||
| (-5, 7) | (0, 2) | y ≤ -x + 2 | ||
| (-5, 7) | (0, 2) | y > -x + 2 | ||
| (-5, 7) | (0, 2) | y < -x + 2 |
Need help? Click for
Interactive popup. Assistance may be required.
.

| Point A | Point B | Inequality | Dashed or Solid Line? | Shading Above or Below? |
| (-8, 7) | (0, 5) | y ≥ -0.25x + 5 | Solid | Above |
| (-8, 7) | (0, 5) | y > -0.25x + 5 | Dashed | Above |
| (−8, 7) | (0, 5) | y < -0.25x + 5 | Dashed | Below |
| (-5, 7) | (0, 2) | y ≤ -x + 2 | Solid | Below |
| (-5, 7) | (0, 2) | y > -x + 2 | Dashed | Above |
| (-5, 7) | (0, 2) | y < -x + 2 | Dashed | Below |
What relationship do you see between the direction of the inequality symbol (less than or greater than) and the location of the shaded region (above or below)?
What relationship do you see between the inequality symbol and the type of line (dashed or solid)?
If the inequality is in standard form, how can you graph the inequality?
Why does the boundary line appear dashed when the inequality symbol is < or > and solid when the inequality symbols is ≤ or ≥?
When graphing one-variable inequalities on a number line, you used an open circle for inequalities containing < or > and a closed circle for inequalities containing ≤ or ≥. How is that similar to using a dashed or solid line for linear, two-variable inequalities?
You can also graph inequalities on a graphing calculator. View this link to learn more about how to graph inequalities on a graphing calculator.
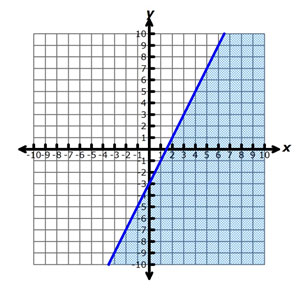
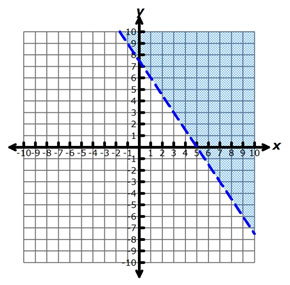
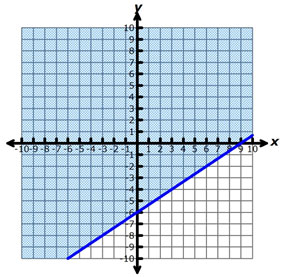
Graph each of the following inequalities.
Interactive popup. Assistance may be required.
What type of line should be graphed: solid or dashed? Which region of the graph should be shaded: above or below?
Interactive popup. Assistance may be required.
Interactive popup. Assistance may be required.
What type of line should be graphed: solid or dashed? Which region of the graph should be shaded: above or below?
Interactive popup. Assistance may be required.
Interactive popup. Assistance may be required.
What type of line should be graphed: solid or dashed? Which region of the graph should be shaded: above or below?
Interactive popup. Assistance may be required.
Interactive popup. Assistance may be required.
What type of line should be graphed: solid or dashed? Which region of the graph should be shaded: above or below?
Interactive popup. Assistance may be required.