In this section, parallel lines are explored. A graphing calculator is needed.
How can parallel lines be identified by looking at a table?
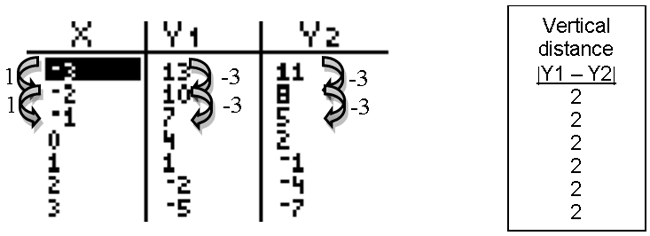
Look at the following table.
Fill in the blanks by using the table on the right of the graph. Click on the blank to check your answer.
- There are several ways to determine if there is a solution from a table, look for a Interactive button. Assistance may be required.
__________
pattern
, calculate the vertical Interactive button. Assistance may be required.
__________
distance
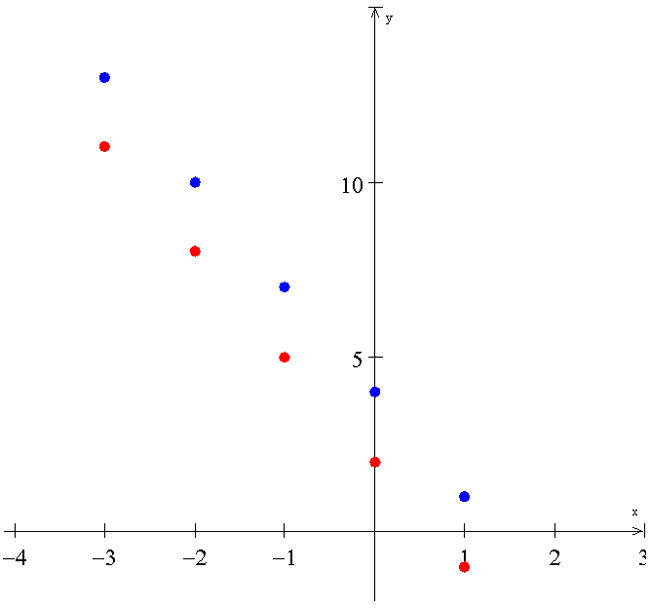
, plot Interactive button. Assistance may be required.
__________
points
and find the Interactive button. Assistance may be required.
__________
slopes
of the lines.
- The vertical Interactive button. Assistance may be required.
__________
distance
is the same between the points; therefore the lines are Interactive button. Assistance may be required.
__________
parallel
.

- The slopes of the lines are Interactive button. Assistance may be required.
__________
the same
, if the slopes are Interactive button. Assistance may be required.
__________
the same
there is not one unique solution. The lines are either coinciding or Interactive button. Assistance may be required.
__________
parallel
.
-
When the points are plotted they appear to be the Interactive button. Assistance may be required.
__________
same
distance apart, showing the lines are Interactive button. Assistance may be required.
__________
parallel
.

- Put the following two functions in your graphing calculator: y = 3x + 4 and y = 3x − 7
-
The slopes of the lines are Interactive button. Assistance may be required.
__________
the same.
-
Press graph, the lines look Interactive button. Assistance may be required.
__________
parallel.
-
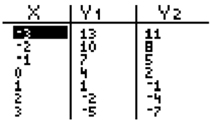
Presses 2nd Graph to display a table of values, the vertical differences are Interactive button. Assistance may be required.
__________
the same.
-
The lines are Interactive button. Assistance may be required.
__________
parallel.


