In this section, intersecting lines are explored.
After clicking on the link below, scroll down until you see the following:

 Intersecting Lines: System of Linear Equations
xxxxxxxxxxxxxxxxxxxxxxxxxxxxxxxxxxxxxxxxxxxxxxxxxx
[Note: The images and numbers below need to be changed to fit the interactive.]
xxxxxxxxxxxxxxxxxxxxxxxxxxxxxxxxxxxxxxxxxxxxxxxxxx
Source: Interactive System of Linear Equations, Mathwarehouse.com
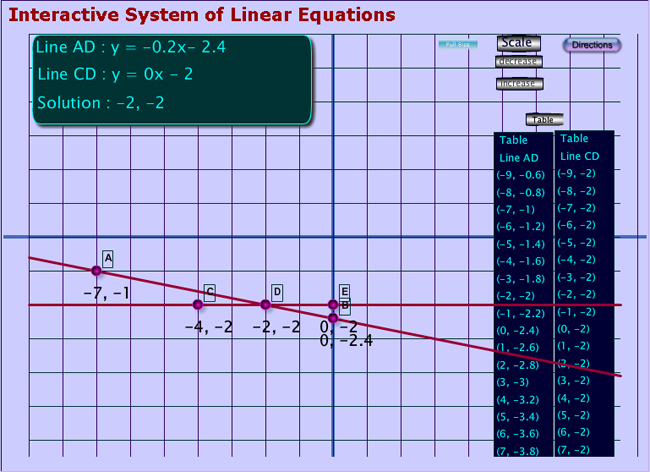
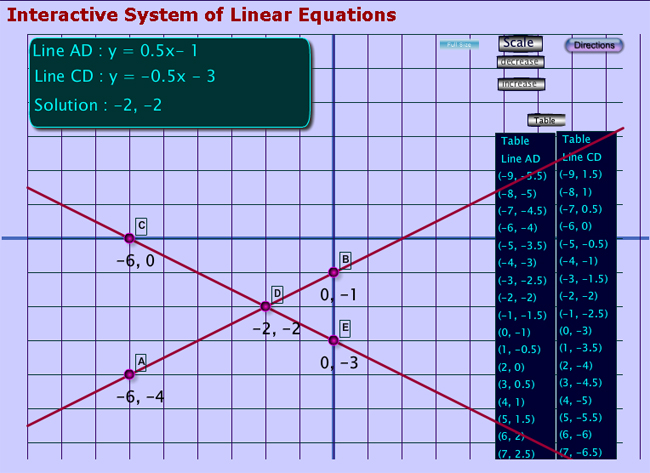
Move point C to (-6, 0) and point A to (-6, -4). The points will snap to the grid. The graph should appear like this.
Source: Interactive System of Linear Equations, Mathwarehouse.com
On your own paper, fill in the blanks by using the table on the right of the graph. Click on the blank to check your answer.
- There is Interactive button. Assistance may be required.
__________
exactly one point
that is the same in the table.
- These lines Interactive button. Assistance may be required.
__________
are not
parallel because the table shows Interactive button. Assistance may be required.
__________
one point of intersection at (-2,-2)
.
(The End of Course Exam could give two separate tables without the common point showing.)
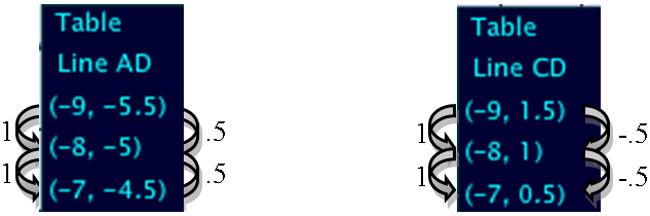
- Also the slope of AD is Interactive button. Assistance may be required.
__________
.5
and the slope of CD is Interactive button. Assistance may be required.
__________
-.5
.
- These lines Interactive button. Assistance may be required.
__________
are not perpendicular because the slope of AD is Interactive button. Assistance may be required.
__________
.5
and the slope of CD is Interactive button. Assistance may be required.
__________
-.5.
-
Since the Interactive button. Assistance may be required.
__________
y-values
are getting farther apart there are no other points of intersection.
Move one of the lines and find the intersection point by looking at the table. Practice several times to see how the table appears when the lines are intersecting.
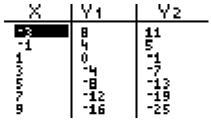
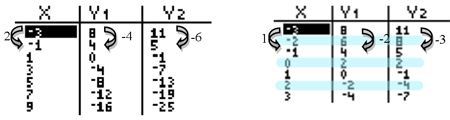
Below is a table of a graph of two lines. The table doesn't show a solution where Y1 and Y2 are the same.
There are three ways to check for a solution if it cannot be seen in the table.
-
By filling in some Interactive button. Assistance may be required.
__________
numbers or Interactive button. Assistance may be required.
__________
extending the table at either end, it is easier to see if there is a Pattern.
-
By filling in the values in between an intersection, Interactive button. Assistance may be required.
__________
(0, 2) is revealed.
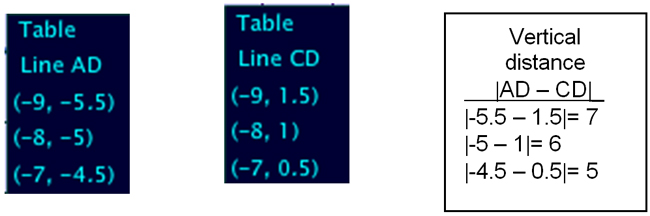
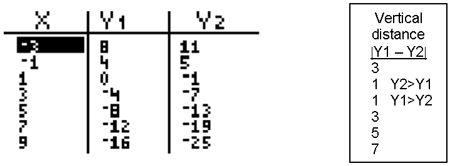
- Another means of checking to see if there is a solution is to calculate the Interactive button. Assistance may be required.
__________
Vertical Distance between the Interactive button. Assistance may be required.
__________
y-values.
-
In the example below, the lines intersect or the Interactive button. Assistance may be required.
__________
solution is between Interactive button. Assistance may be required.
__________
x = -1 and Interactive button. Assistance may be required.
__________
x = 1 because the Interactive button. Assistance may be required.
__________
vertical distance
between Y1 and Y2 is Interactive button. Assistance may be required.
__________
1 for both x coordinates.
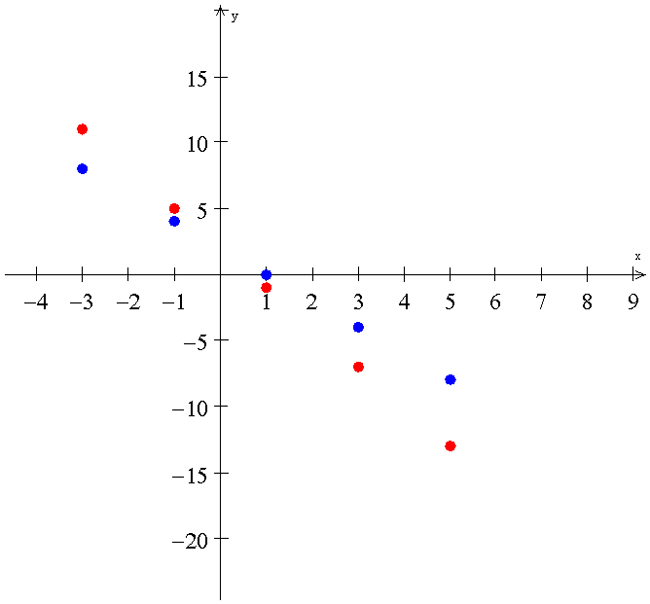
-
The third way to check for a Interactive button. Assistance may be required.
__________
solution or Interactive button. Assistance may be required.
__________
intersection is to Interactive button. Assistance may be required.
__________
Plot Points.
-
Plot the Interactive button. Assistance may be required.
__________
given points and continue the slope pattern.
-
In the example below Y1 is blue and Y2 is Interactive button. Assistance may be required.
__________
red.
- Notice the change between Interactive button. Assistance may be required.
__________
-1 and Interactive button. Assistance may be required.
__________
1, where red is on top and then blue is on top.
-
Draw a line through each set of points to determine the Interactive button. Assistance may be required.
__________
intersection/solution.