In this resource, you investigated several different ways to determine the x-intercept and y-intercept of a linear function. You used graphs, tables, and equations to determine the intercepts of linear functions. You also investigated how to interpret the intercepts within the context of a situation.
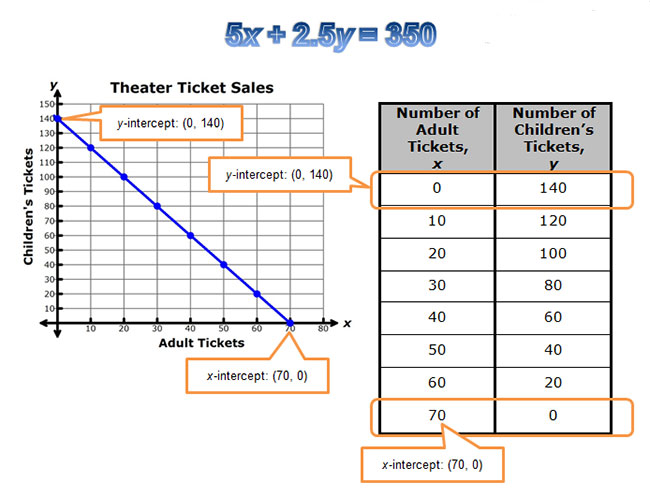
Consider the graph, equation, and table shown below.
In each representation, the x-intercept is the point where the graph of the line crosses the x-axis, or the ordered pair (x, 0). The y-intercept is the point where the graph of the line crosses the y-axis, or the ordered pair (0, y).