You can also use a table of values to determine and interpret the intercepts of a function. The graph below represents the relationship between the floor number and the amount of time that Senedra has been in an elevator. Senedra is in an office building in Europe, where the ground floor is labeled "floor 0" and the next floor up is labeled "floor 1."
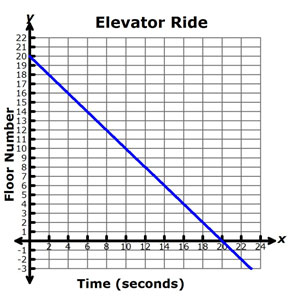
Copy and paste the table below into your notes. Use the graph to complete the table.
Time (seconds) |
Floor (number) |
0 |
|
4 |
|
8 |
|
12 |
|
20 |
|
22 |
Interactive popup. Assistance may be required.
Time (seconds) |
Floor (number) |
0 |
20 |
4 |
16 |
8 |
12 |
12 |
8 |
20 |
0 |
22 |
-2 |

Use your graph and table to answer the following questions.
Interactive popup. Assistance may be required.
The y-intercept is where the graph crosses the y-axis.
Interactive popup. Assistance may be required.
(0, 20)
Interactive popup. Assistance may be required.
Where does the graph of the line intersect the y-axis?
Interactive popup. Assistance may be required.
The point (0, 20) represents when Senedra got on the elevator, at the 20th floor.
Interactive popup. Assistance may be required.
The x-intercept is where the graph crosses the x-axis.
Interactive popup. Assistance may be required.
(20, 0)
Interactive popup. Assistance may be required.
Where does the graph of the line intersect the x-axis? What might a y-value of 0 represent?
Interactive popup. Assistance may be required.
The point (20, 0) represents the time it took Senedra to reach the ground floor, floor 0.
What does an x-intercept look like in a table of values?
Interactive popup. Assistance may be required. The y-value in a row is 0.
How does the x-intercept in a table compare to the x-intercept in a graph?
Interactive popup. Assistance may be required. The x-intercept in a graph is the point where the graph of the function crosses the x-axis. This point has coordinates (x, 0); so in a table, there will be a non-zero number in the x-column and 0 in the y-column.
What does a y-intercept look like in a table of values?
Interactive popup. Assistance may be required. The x-value in a row is 0.
How does the y-intercept in a table compare to the y-intercept in a graph?
Interactive popup. Assistance may be required. The y-intercept in a graph is the point where the graph of the function crosses the y-axis. This point has coordinates (0, y); so in a table, there will be a non-zero number in the y-column and 0 in the x-column.
Interpret both the x- and y-intercepts in the relationships shown in the tables below.
Time in Hours, x |
Distance in Miles, y |
0 |
240 |
1 |
180 |
2 |
120 |
11 over 2
1
2
|
90 |
4 |
0 |
Interactive popup. Assistance may be required.
Identify the variable represented by the labels in the header row of the table.
Interactive popup. Assistance may be required.
The x-intercept, (4, 0), shows that after driving 4 hours, there are 0 miles remaining; the bus arrives in Dallas after 4 hours.
Number of Bushels of Corn, x |
Number of Bushels of Wheat, y |
0 |
300 |
40 |
250 |
70 |
212.5 |
166 |
92.5 |
240 |
0 |
Interactive popup. Assistance may be required.
Identify the variable represented by the labels in the header row of the table.
Interactive popup. Assistance may be required.
The x-intercept, (240, 0), shows that if the farmer plants all corn, she can harvest 240 bushels of corn.