
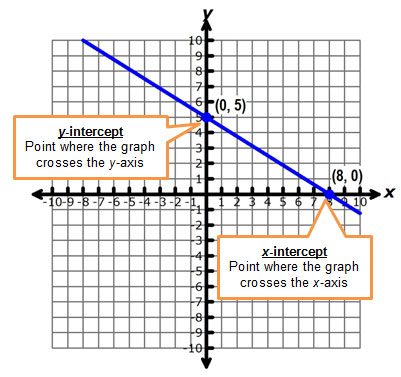
An intercept of any function is a point where the graph of the function crosses, or intercepts, the x-axis or y-axis.
Because there are two axes on a coordinate plane, there can be a x-intercept, which is the point where the graph crosses the x-axis, or a y-intercept, which is the point where the graph crosses the y-axis.
When the linear function is used to represent a real-world situation, the intercepts have significant meaning in the context of the problem.
 In the interactive below, you are given a graph that represents a linear function for a particular situation. Identify the x-intercept and y-intercept from the graph by locating the coordinates of the point where the graph crosses the x-axis and the y-axis, respectively. Match the best interpretation of each intercept by clicking and dragging the sentence from the Description Bank to the slot next to each graph.
How can you distinguish between the x-intercept and the y-intercept from a graph?
Interactive popup. Assistance may be required. Which intercept corresponds with which axis? Interactive popup. Assistance may be required.
The x-intercept is the point where the graph crosses the x-axis (horizontal axis) and the y-intercept is the point where the graph crosses the y-axis (vertical axis).
Interactive popup. Assistance may be required.
The x-intercept is the point where the graph crosses the x-axis (horizontal axis) and the y-intercept is the point where the graph crosses the y-axis (vertical axis).
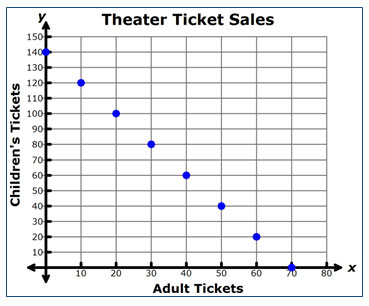
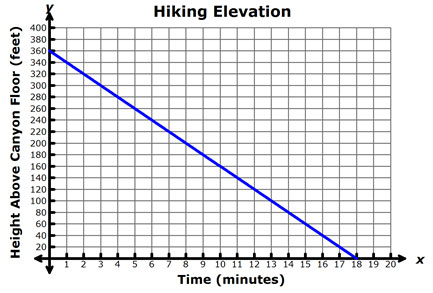
Interpret both the x- and y-intercepts in the relationships shown in the graphs below.
Interactive popup. Assistance may be required.
The x-intercept, (70, 0), shows that if the theater sells only adult tickets, they must sell 70 adult tickets in order to generate $350 in revenue.
Interactive popup. Assistance may be required.
The x-intercept, (18, 0), shows that in 18 minutes, the height of the hiker above the canyon floor will be zero; in other words, the hiker will reach the canyon floor in 18 minutes.