In a previous resource, you met the Williams family, who took a road trip to visit relatives for the holidays. Mrs. Williams drives at an average speed of 60 miles per hour. You used a table to represent the situation where Mrs. Williams drove for x hours and covered a distance of y miles.
Now, let’s consider the situation where the Williams family is coming home from visiting relatives. Mrs. Williams has to drive 350 miles in order to get home. Even though there is road construction, the family still drives at a constant rate; however, it takes them longer to drive home than it did to get to their relatives' house. Shonda Williams was bored, so she kept track of how many miles, y, remained until they got home after a certain amount of time, x, had passed. Shonda’s data appears in the table below.
Return Trip Home |
|
Amount of Time Since Leaving Relatives (in hours), x |
Number of Miles Remaining, y |
0.5 |
325 |
1 |
300 |
1½ |
275 |
2.5 |
225 |
4 |
150 |
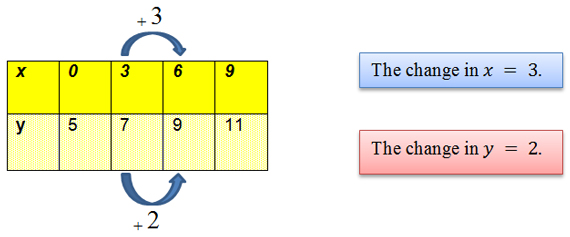
Use the interactive below to help you determine the slope of the function representing the Williams family’s return trip home.
 Mouse over each row of the table to see the change in x and the change in y. Use that information to calculate the slope of the function. Remember, slope is the ratio of the change in y to the change in x.
What is the slope of the linear function representing the relationship between the amount of time since leaving the Williams family’s relatives’ house, x, and the number of miles remaining, y, until the Williams family is back home?
Remember, slope can be found using the following formula:
Slope = Δy over Δx Δy Δx = change in y over change in x Change in y Change in x

If you select a different pair of numbers from the table, do you get a different value for the slope? Why do you think that is the case?
Interactive popup. Assistance may be required. No. Linear functions have a constant slope, or constant rate of change, so it will not matter which pair of corresponding values that you select from the table, you will always get the same slope.
How is this method related to the slope formula?
Interactive popup. Assistance may be required. The slope formula, m = y2 – y1 x2 – x1 , also uses the ratio of the change in y to the change in x. If you select two points from the table, you can also use the slope formula to determine the slope of the line represented by the ordered pairs in the table.
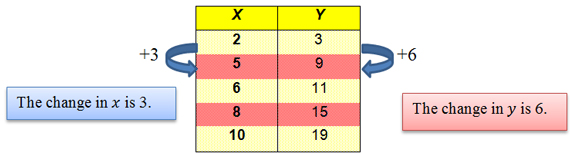
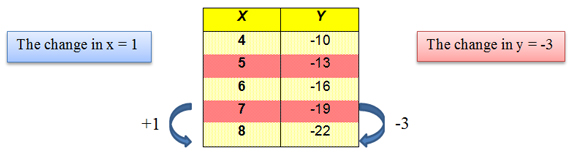
Using the tables below, find the change in y and x to determine the slope.
| X | Y |
|---|---|
| 2 | 3 |
| 5 | 9 |
| 6 | 11 |
| 8 | 15 |
| 10 | 19 |
| X | Y |
|---|---|
| 4 | -10 |
| 5 | -13 |
| 6 | -16 |
| 7 | -19 |
| 8 | -22 |
| X | 0 | 3 | 6 | 9 |
| Y | 5 | 7 | 9 | 11 |