In this resource, you investigated how to interpret changes in slopes and rates of change for linear functions using graphs, tables, and equations.
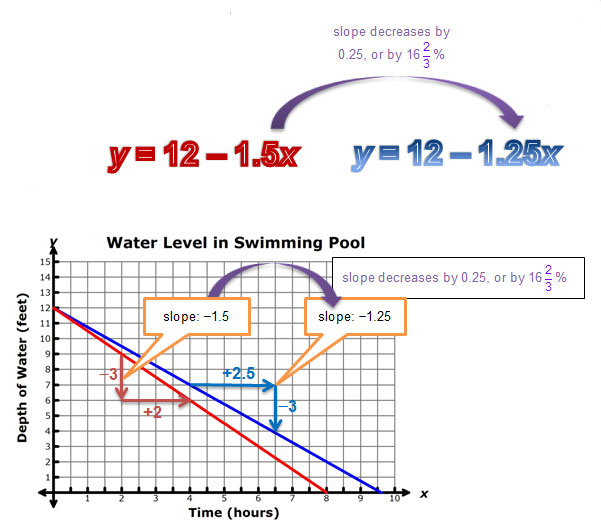
Consider the graphs, equations, and tables shown below. Each pair compares draining a pool with 12 feet of water at a rate of 1.5 feet per hour to draining a pool with 12 feet of water at the a rate of 1.25 feet per hour.
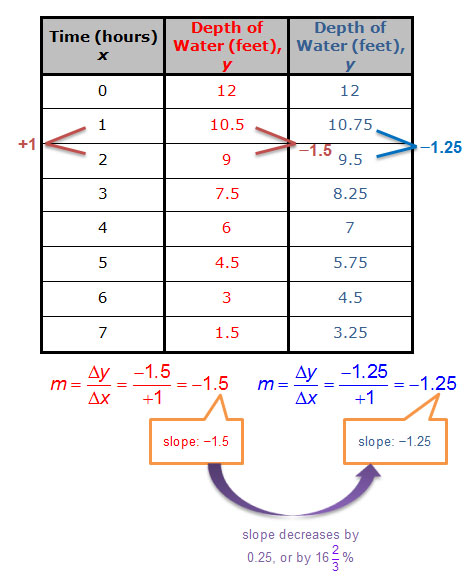
In each representation, the original slope of −1.5 feet per hour changes to −1.25 feet per hour which is a decrease of 0.25 feet per hour, or 162 over 3 2 3 % from the original value.