In a previous resource, you learned about how changes in m and b affect the graph of y = mx + b. In other words, the slope, m, affects the steepness of the graph, and the y-coordinate of the y-intercept, b, affects where the graph crosses the y-axis.
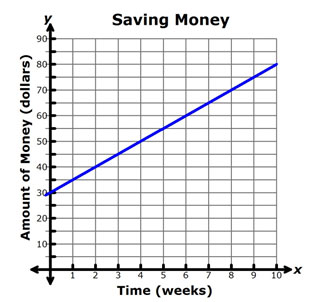
Alyssa received $30 from her favorite aunt for her birthday. She wants to save her money to purchase an e-reader. She decided to save the $30 and add $5 from her own money each week. The amount of money that she has saved as a function of time is shown in the graph below.
Interactive popup. Assistance may be required.
5
Interactive popup. Assistance may be required.
Alyssa is saving money at a rate of $5 per week.
 Alyssa wants to consider several different savings options as compared to the one shown in the graph above. In the interactive below, match each graph with the situation that best describes what you notice about the slope in the graph.
How can you tell if a change in a situation with a positive rate of change will increase the slope or decrease the slope?
Interactive popup. Assistance may be required. For a positive rate of change, if the rate of change increases, the graph of the line will be steeper. If the rate of change decreases, the graph of the line will be less steep.
How can you tell if a change in a situation with a negative rate of change will increase the slope or decrease the slope?
Interactive popup. Assistance may be required. For a negative rate of change, if the rate of change increases, the graph of the line will be less steep. If the rate of change decreases, the graph of the line will be steeper.
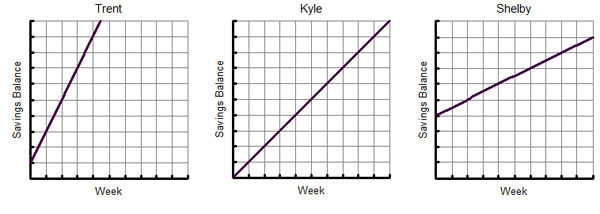
Use the graphs below to answer Questions 1 – 3. Assume that the scales on all 3 graphs are the same. The graphs represent the savings of three students.
Interactive popup. Assistance may be required.
Which graph has the steepest line?
Interactive popup. Assistance may be required.
Trent
Interactive popup. Assistance may be required.
Which graph has the least steep line?
Interactive popup. Assistance may be required.
Shelby
Interactive popup. Assistance may be required.
How will doubling the rate of savings affect the slope of the line?
Interactive popup. Assistance may be required.
Shelby and Kyle would be saving at the same rate, so the slopes of the two lines would be the same.