In this resource, you investigated how to interpret changes in y-intercepts for linear functions using graphs, tables, and equations.
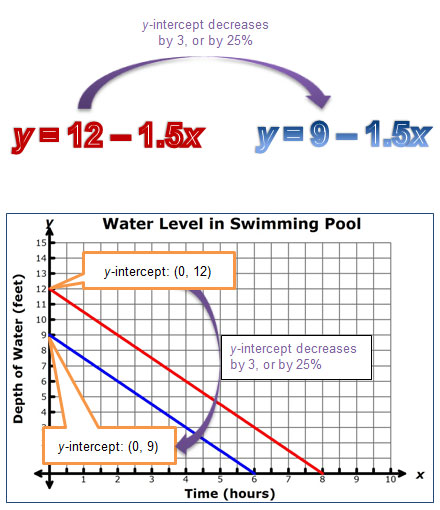
Consider the graphs, equations, and tables shown below. Each pair compares draining a pool with 12 feet of water at a rate of 1.5 feet per hour to draining a pool with 9 feet of water at the same rate.
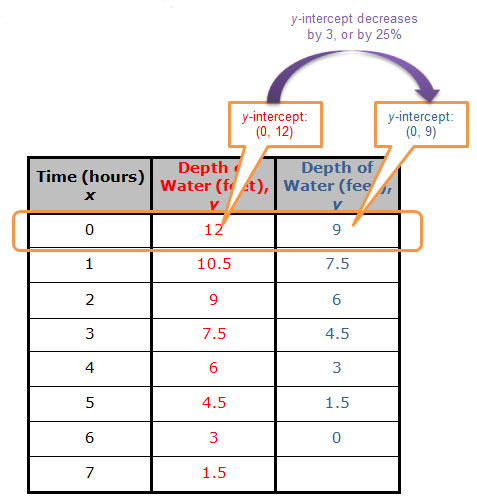
In each representation, the y-intercept begins at (0, 12), and shows a decrease of 3 feet, or 25% from the original value of 12 feet, to a y-intercept of (0, 9).