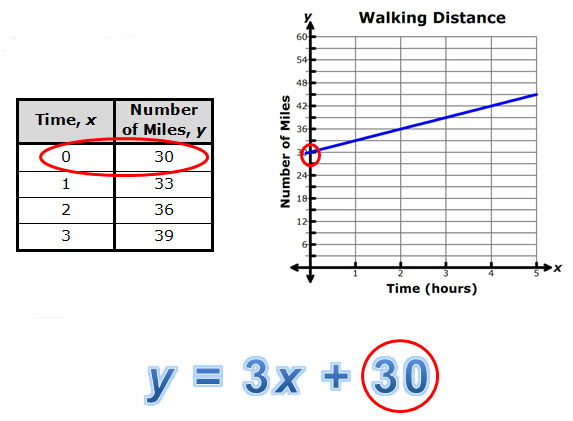
In previous resources, you investigated different ways to determine and interpret intercepts of linear functions. Linear functions can appear in a variety of representations.


Regardless of the representation, you can determine the coordinates of the y-intercept. If the table, graph, equation, or set of data describes a problem situation, you can interpret the y-intercept.
In the examples shown, the y-intercept of (0, 30) can be interpreted as the number of miles walked in 0 hours into the data recording. In other words, before the data was being collected in this time period, the person had already walked a total of 30 miles.
In this resource, you will use what you know about y-intercepts to make predictions about how a change in the situation will affect the y-intercept of the function describing that situation.