You will need your graphing calculator for this section of the resource.

Using your calculator, follow the steps below to be sure that the expression 4x – 3 correctly describes the tile pattern from Section 1.

Step 1: Enter the expression into your calculator creating the equation y = 4x – 3. The expression 4x – 3 is shown entered in the Y= screen of a graphing calculator
Step 2: Graph the equation. Be sure to set the window values. The graph of the equation y = 4x – 3 is shown
Step 3: Compare your calculator graph to the graph you created in Section 1. They should match. The window is different so be careful. a graph of the data seen in the previous section is shown again
Step 4: Use the table feature on your calculator to display a table where the x-values range from 0 to 6. Decide if your calculator table matches the table we created in Section 1. A table of data using the Table feature of a graphing calculator is shown

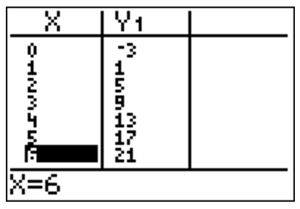
The calculator table matches the original table perfectly. It's OK that the table you made is missing (0, -3) and (6, 21). The important thing is that the 5 rows in your table match the calculator.

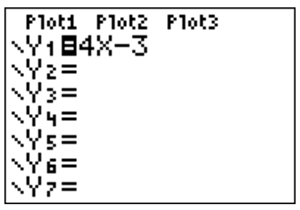
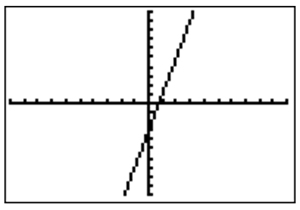
Since the tables and graphs all match we know that the installer can use the equation, y = 4x – 3, (or the expression 4x – 3) to determine how many tiles he needs depending on the drawing number.
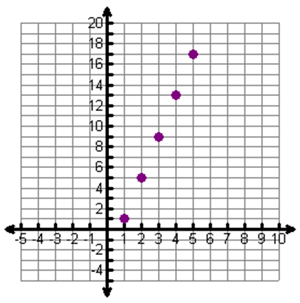

Drawing Number of Tiles
1 1
2 5
3 9
4 13
5 17