
In this resource you will write an algebraic expression that describes a pictorial or tabular representation of a pattern.
A tile floor installer is creating the following pattern using very expensive marble tiles. He starts in the center of a square room and works his way out until he hits a wall.
It would not be hard for him to count the number of tiles needed for a room in a house. But what if this was a pattern outside a large new sports arena? It will be very costly if he orders too few tiles since it will delay his work. It will be very costly to order too many because there is a restocking fee if he returns these expensive tiles. He needs to get his order as close as possible. Our goal will be to write an expression that will let us know how many tiles will be needed for any size drawing.
Organization is the key here. Make a table. You'll need to decide on things such as what you're comparing and what is the independent variable and dependent variable.
Think about how you would organize the table below. Click on the blanks in the table below to reveal how to record the data.
| Drawing | Number of Tiles |
| Interactive button. Assistance may be required. ____ 1 | Interactive button. Assistance may be required. ____ 1 |
| Interactive button. Assistance may be required. ____ 2 | Interactive button. Assistance may be required. ____ 5 |
| Interactive button. Assistance may be required. ____ 3 | Interactive button. Assistance may be required. ____ 9 |
You may have wanted to label the columns slightly differently. "Number of Tiles" is a more precise label than just "Tiles."
The number of tiles in each drawing depends on which drawing in the pattern you are using. So the number of tiles is the dependent variable. We put the independent variable in the left column and the dependent in the right column.
Think about how many tiles would be in the 4th drawing and 5th drawing. Scroll down to see an expanded table.
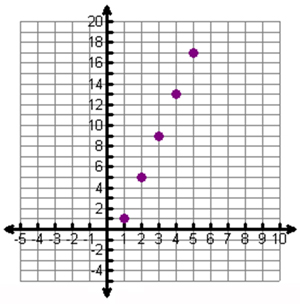
We're still organizing our data. The next thing you may want to do is graph the points. Think about how a graph of these points might look.
Scroll down to see the graph.
|
|
The graphed data looks like a line. You learned slope-intercept form before where y = mx + b.
Click on the blanks to reveal the answers.