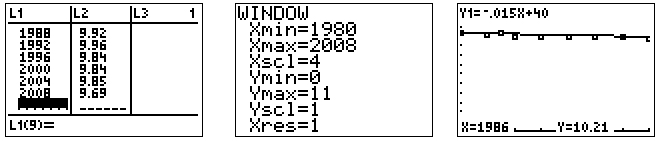
1. To the right is an updated chart of men’s 100 m Olympic times. Put the data into your graphing calculator. What equation do you get?

Olympic 100 m

Year Time (sec)
1980 10.25
1984 9.99
1988 9.92
1992 9.96
1996 9.84
2000 9.84
2004 9.85
2008 9.69
Interactive popup. Assistance may be required.

Check Your Answer

graphing calculator displays showing a line of best fit for the given data with equation y = -.015x + 40Close Pop Up
  1. Below is the sample data that we used for the Spaghetti Bridge before. Put it into the graphing calculator and see what line of best fit you get.

Spaghetti Bridge

Number of Pieces of Spaghetti Number of Marbles to Break Spaghetti
1 18
2 40
3 56
4 70
graphing calculator displays showing a line of best fit for the given data with equation y = 17.2x + 3

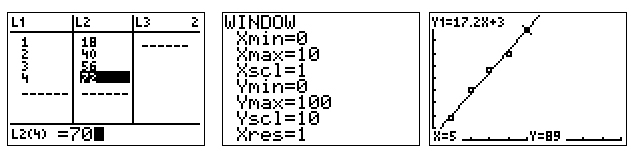
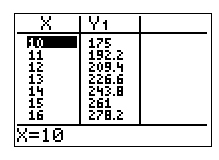
You may have gotten a slightly different equation, but let’s use y = 17.2x + 3 to make predictions.

How many marbles would a 10 spaghetti bridge hold? Use the Table to find out.

If you want to practice more lines of best fit, there are several other sets of data that you can use in the resources.

Interactive popup. Assistance may be required.

Check Your Answer

175 Marbles
graphing calculator displays showing x = 10 and  y = 175Close Pop Up