Regression Activity
Another activity that you can do is to find the line of best fit for a data set. You can use the same interactive webpage as before to find the line of best fit. Is there a relationship between the fat grams and the total calories in fast food?
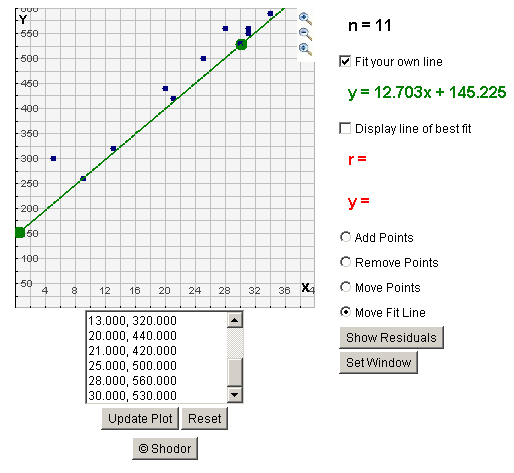
| Sandwich | Total Fat (g) | Total Calories |
| Hamburger | 18 | 260 |
| Cheeseburger | 40 | 320 |
| Quarter Pounder | 56 | 420 |
| Quarter Pounder with Cheese | 70 | 530 |
| Big Mac | 31 | 560 |
| Arch Sandwich Special | 31 | 550 |
| Arch Special with Bacon | 34 | 590 |
| Crispy Chicken | 25 | 500 |
| Fish Fillet | 28 | 560 |
| Grilled Chicken | 20 | 440 |
| Grilled Chicken Light | 5 | 300 |
Go to the website used earlier in the resource.
Using your notes and your green and red equations, predict the number of calories would be in a sandwich that contains 40 grams of fat. Then discuss why the answers are different.