Go to this interactive webpage and input your data into the box below the graph.
If you did not get to make the Spaghetti Bridge, you can still work with data that someone else has collected. This table shows the data collected by someone else for a Spaghetti Bridge.
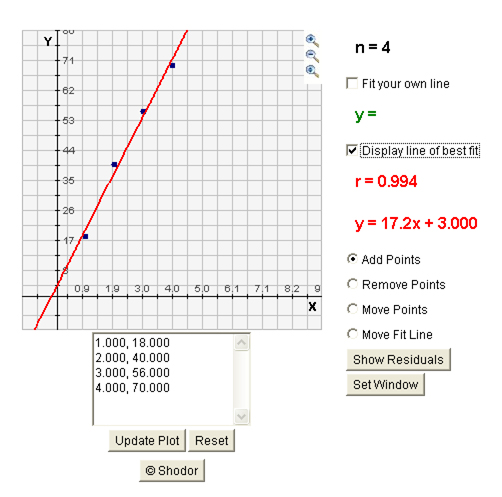
| Number of Pieces of Spaghetti | Number of Marbles to Break Spaghetti |
| 1 | 18 |
| 2 | 40 |
| 3 | 56 |
| 4 | 70 |
You may want to make predictions such as how many marbles a 10 spaghetti bridge could hold.
Go to this interactive webpage and input your data into the box below the graph.
This line of best fit is the closest line that can approximate the data from the Spaghetti Bridge. This equation can now be used to estimate how many marbles 10 pieces of spaghetti would hold. Your activity page should now look something like the following image.
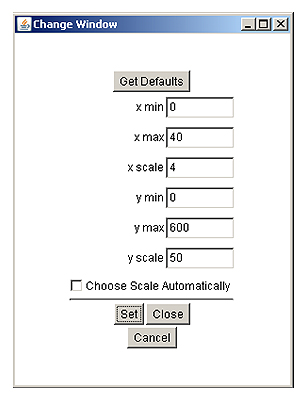
To estimate the number of marbles, you can substitute 10 in for the pieces of spaghetti, x-value, or you can reset the graph by pressing Set Window window.
The Change Window will open (as shown on the right) to set the x and y values for the graph. Since you know you want to see at least 10, set the x-value for 12 and set the y-value for a higher number. Press Set at the bottom to change the window and then press Close to see your graph. Can you see the value for 10? If not, set the window again to a larger y-value.
Answer the following questions using your notes.