One way to understand a problem in order to analyze it is to create a table or a graph.
Example: Natalie and Anna are training for the Houston Marathon. Natalie can run six miles per hour, and Anna can run eight miles per hour. After
1
1
2
hours, how far have Natalie and Anna traveled?
Source: Euthman/Flickr
There are many ways to solve this problem. A picture or model can be created to visualize the distance Natalie and Anna run in an hour.
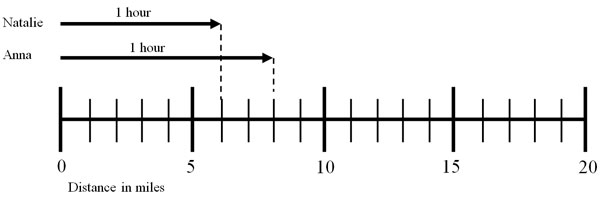
From the picture, you can see that after one hour, Natalie runs six miles, and Anna runs eight miles.
Fill in the blanks.
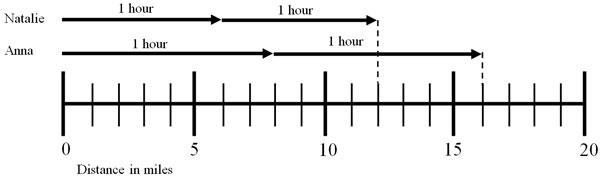
- In two hours Natalie can run Interactive button. Assistance may be required.
_____
12
miles and Anna can run Interactive button. Assistance may be required.
_____
16
miles.
- To find out how far they can run in 1
1
2
hours, we can look at the model half way between the Interactive button. Assistance may be required.
_____
one
hour and Interactive button. Assistance may be required.
_____
two
hour mark.
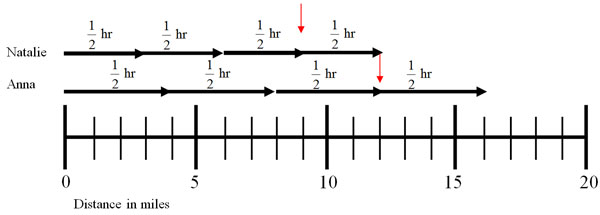
- In 1
1
2
hours, Natalie can run Interactive button. Assistance may be required.
_____
9
miles and Anna can run Interactive button. Assistance may be required.
_____
12
miles.
Anna will complete the marathon faster than Natalie because Anna is running at a faster
rate.
This information can be written in a table. Click on the blanks to check your answer.
| Natalie's Information |
|
Anna's Information |
Time
(hours) |
Distance
(miles) |
|
Time
(hours) |
Distance
(miles) |
| 1 |
6 |
|
1 |
8 |
| 2 |
12 |
|
2 |
16 |
| 3 |
Interactive button. Assistance may be required.
_____
18
|
|
3 |
Interactive button. Assistance may be required.
_____
24
|
| 4 |
Interactive button. Assistance may be required.
_____
24
|
|
4 |
Interactive button. Assistance may be required.
_____
32
|
Since Natalie runs at a speed of Interactive button. Assistance may be required.
_____
6
miles per hour, her distance can be calculated by multiplying her rate of Interactive button. Assistance may be required.
_____
speed
by the time. Example: 3 hours × 6 mph ⇒ 3 × 6 = 18 miles.
- In 4 hours if Natalie runs at a consistent rate she could run Interactive button. Assistance may be required.
_____
24 miles
.
- In 2
1
2
hours, she could run Interactive button. Assistance may be required.
_____
15 miles
.
- In Interactive button. Assistance may be required.
_____,
5 hours
Natalie could run 30 miles.
- In order to find out how long it would take Natalie to run the Interactive button. Assistance may be required.
_____
26
mile marathon an equation is needed.
- The equation is Interactive button. Assistance may be required.
_____
y = 6x
where y is the distance traveled and x is the number of hours run.
-
Substitute.
Interactive button. Assistance may be required.
_____
26
in for the number of miles, Interactive button. Assistance may be required.
_____
y
.
- Solve for x: Interactive button. Assistance may be required.
_____
y = 6x
26 = 6x
4
1
3
= x
1
3
= x
1
3
= x
.
- One-third of an hour is Interactive button. Assistance may be required.
_____
20
minutes.
- It would take Natalie Interactive button. Assistance may be required.
_____
4 hours and 20 minutes
to finish the 26 mile marathon.
- In 4 hours if Anna ran at a constant rate she would run Interactive button. Assistance may be required.
_____
32 miles
.
- In 3 hours, she would run Interactive button. Assistance may be required.
_____
24 miles
.
- In 2
1
2
hours, she would run Interactive button. Assistance may be required.
_____
20 miles
.
- In Interactive button. Assistance may be required.
_____,
5 hours
Anna could run 40 miles.
- In order to find out how long it would take Anna to run the Interactive button. Assistance may be required.
_____
26 mile marathon, an equation is needed.
- The equation is Interactive button. Assistance may be required.
_____
y = 8x where y is the distance traveled and x is the number of hours run.
- Substitute Interactive button. Assistance may be required.
_____
26
in for the number of miles, Interactive button. Assistance may be required.
_____
y
.
- Solve for x: Interactive button. Assistance may be required.
_____
y = 8x
26 = 8x
3
1
4
= x
- One-fourth of an hour is Interactive button. Assistance may be required.
_____
15
minutes.
- It would take Anna Interactive button. Assistance may be required.
_____
3 hours and 15 minutes
to finish the 26 mile marathon.
- If Natalie and Anna start the marathon at 8 A.M., Natalie would finish the marathon at Interactive button. Assistance may be required.
_____
12:20 P.M
and Anna would finish the marathon at Interactive button. Assistance may be required.
_____
11:15 A.M
.

Source: Michael Wimpee/Flickr
Example: Anna and Natalie have to arrive to check in for the marathon at 7 A.M. in order to have enough time walk to the start line. After the marathon, it will take 30 minutes to walk from the finish line back to their car. The convention center parking lot charges $5 per hour or part of an hour to park. Should Anna and Natalie carpool and split the parking fees or is it cheaper for Anna to take her own car and leave when she finishes the race?
- If Natalie and Anna started the race at 8 A.M., then Natalie would finish the marathon at Interactive button. Assistance may be required.
_____
12:20 P.M and Anna would finish the marathon at Interactive button. Assistance may be required.
_____
11:15 A.M
.
- If Anna takes her own car, it will be in the parking lot Interactive button. Assistance may be required.
_____
1
hour before the marathon starts.
- Anna will finish the marathon in Interactive button. Assistance may be required.
_____
3
hours and Interactive button. Assistance may be required.
_____
15
minutes.
- Anna will return to the parking lot at Interactive button. Assistance may be required.
_____
11:15 AM
.
- To find the total number of hours Anna's car would be parked, subtract Interactive button. Assistance may be required.
_____
11:15 A.M.
from Interactive button. Assistance may be required.
_____
11:45 A.M.
.
- Anna's car would be parked Interactive button. Assistance may be required.
_____
4
hours and Interactive button. Assistance may be required.
_____
45
minutes.
- Since the convention parking lot charges $5 for all or part of an hour, Anna will be charged for Interactive button. Assistance may be required.
_____
4
hours and Interactive button. Assistance may be required.
_____
45
minutes.
- Anna would be charged Interactive button. Assistance may be required.
_____
$25
to park in the convention parking lot if she did NOT carpool.
- Natalie would finish the race at Interactive button. Assistance may be required.
_____
12:20 P.M.
.
- Natalie would return to the parking lot at Interactive button. Assistance may be required.
_____
12:50 P.M.
.
- It would be approximately Interactive button. Assistance may be required.
_____
1
hour later than Anna's return to the parking lot.
- If Anna and Natalie carpooled to the marathon, they would be charged Interactive button. Assistance may be required.
_____
$5
more than Anna driving alone or Interactive button. Assistance may be required.
_____
$30
.
- Since they would split the cost, Anna would pay Interactive button. Assistance may be required.
_____
$15
to park.
- Anna and Natalie Interactive button. Assistance may be required.
_____
should
carpool to the marathon because it is cheaper.