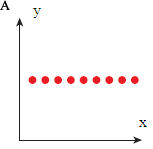
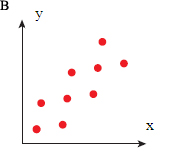
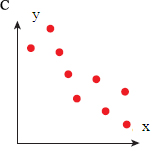
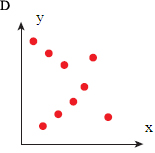
Which graph below is the best example of a negative correlation? (Click on each image below to check your answer.)
Interactive popup. Assistance may be required.
 Interactive popup. Assistance may be required.
Interactive popup. Assistance may be required.
Interactive popup. Assistance may be required.
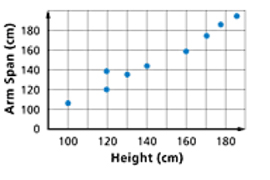
The graph below shows the height and arm span for a group of 10 people. Determine whether the graph shows a positive correlation, a negative correlation, or no correlation. If there is a positive or negative correlation, describe its meaning in the situation.
 Interactive popup. Assistance may be required.
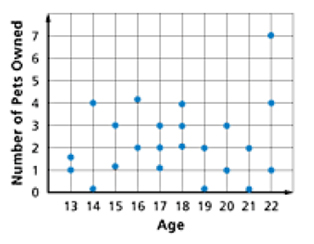
The graph below shows the age of 20 people and the number of pets owned. Determine whether the graph shows a positive correlation, a negative correlation, or no correlation. If there is a positive or negative correlation, describe its meaning in the situation.
 Interactive popup. Assistance may be required.