Strategies

  1. The graph below shows the relationship between temperature and the density of water. Which of the following statements best describes this relationship? (Click on each answer for feedback.)
  1. Interactive popup. Assistance may be required.

    The density of water increases as temperature increases between 4°C and 10°C.

    Incorrect. The graph between 4°C and 10°C is decreasing. Close Pop Up
  2. Interactive popup. Assistance may be required.

    The density of water decreases as temperature increases between 0°C and 4°C.

    Incorrect. The graph between 0°C and 4°C is increasing. Close Pop Up
  3. Interactive popup. Assistance may be required.

    The density of water decreases as temperature increases between 4°C and 10°C.

    Correct. Close Pop Up
  4. Interactive popup. Assistance may be required.

    The density of water remains constant as temperature increases.

    Incorrect. Constant would be displayed as a horizontal line.
    Close Pop Up
  1. Two car-rental companies are advertising special rates for a midsize car. Wendell’s Motor Rentals is advertising a rate of $35 a day plus $0.20 per mile traveled, tax included. Marina’s Car Rentals is advertising a rate of $25 a day plus $0.40 per mile traveled, tax included. Which graph correctly compares the cost of renting a midsize car for one day from each company? (Mouseover each image for feedback on that answer.)
  1. The graph below shows the decrease in the value of a personal computer over a period of 60 months.

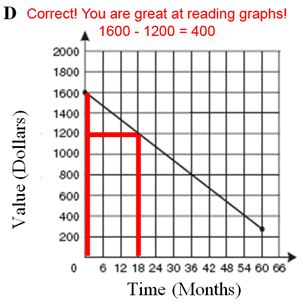
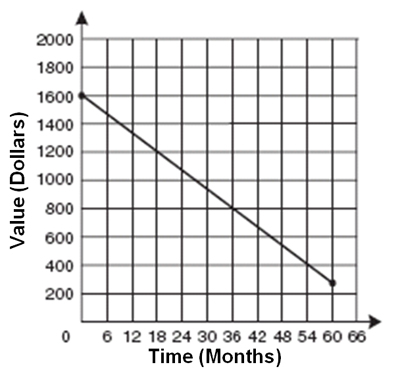
Which is a reasonable conclusion about the value of this personal computer during the time shown on the graph? (Click on each answer for feedback.)

  1. Interactive popup. Assistance may be required.

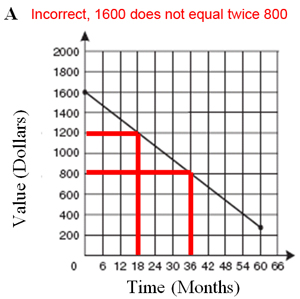
    Its value at 18 months was twice its value at 36 months.

    Close Pop Up
  2. Interactive popup. Assistance may be required.

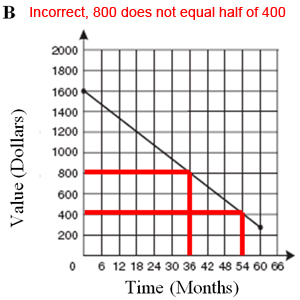
    Its value at 36 months was half its value at 54 months.

    Close Pop Up
  3. Interactive popup. Assistance may be required.

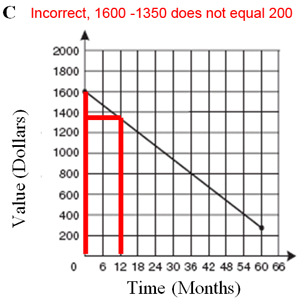
    It depreciated $200 every 12 months.

    Close Pop Up
  4. Interactive popup. Assistance may be required.

    It depreciated $400 every 18 months.

    Close Pop Up
  1. To train for a bicycle road race, Enrique needs to ride 150 miles per week at an average rate of 25 miles per day. To plan his training, Enrique can graph the number of miles, M, left to ride after d days. Which graph shows the number of miles Enrique has left to ride after d days? (Mouseover each image for feedback on that answer.)