 The biker started decreasing his speed while going up an incline, then leveled off for about 10 units, decreased his speed going up a ramp again followed by a maintained speed for about 5 units before down the ramp while his speed increased.
In this resource you will interpret situations in terms of graphs or create situations to fit a graph.
Using an applet called Animation of a Biker, you can create graphs to match situations.
The concepts that can be investigated with Animation of Biker applet are distance, velocity, and acceleration.


Directions:
Describe in words what is happening in each graph below. Check your responses by clicking on the image.
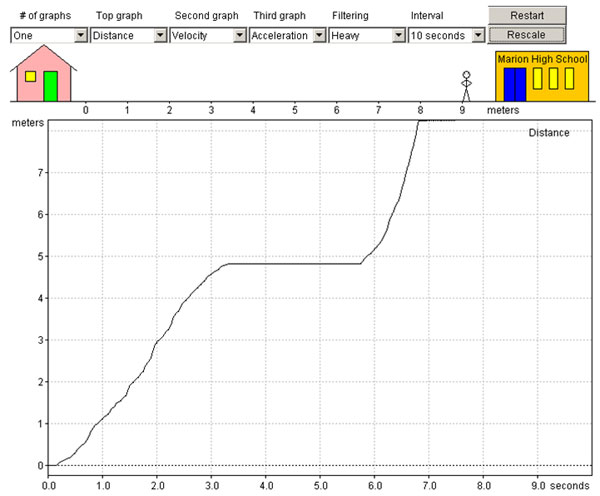
A.
Interactive button. Assistance may be required.
The biker started decreasing his speed while going up an incline, then leveled off for about 10 units, decreased his speed going up a ramp again followed by a maintained speed for about 5 units before down the ramp while his speed increased.
B.
Interactive button. Assistance may be required.
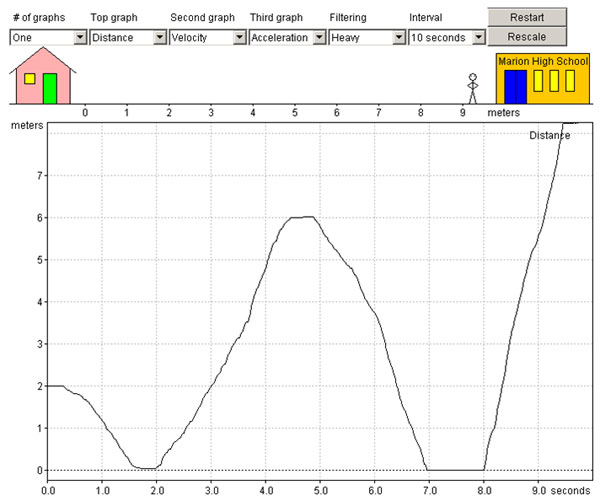 The biker started decreasing his speed while going up an incline, but then quickly sped up while going down an incline, then he gradually went up, the incline got steeper so his speed slowed down a little more and then finally a slow decent, speeding up slowly as he reached the end.
Once you know how to use the MovingMan applet and have experimented with it, examine the above two graphs and try to recreate the graphs using the MovingMan applet.
Record the following responses in your notes.
Questions: