In this resource, you will learn about domain and range.
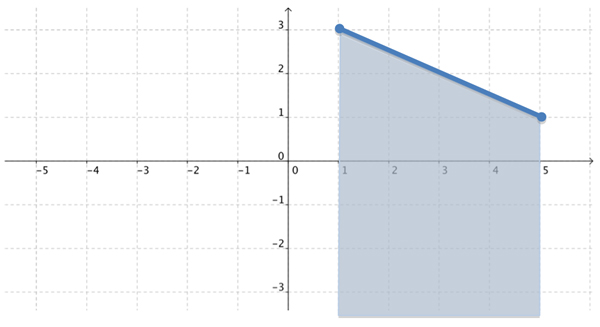
To determine the domain of a function from the graph, identify the set of all the x-coordinates in the function’s graph.
In this example, the domain is since 1≤ x ≤ 5 since 1 is the least x-value and 5 is the greatest x-value.
Notice that the points at either end of the line segment are closed circles. This indicates that these two points are included in the solution.
Also, notice all of the real number points between the closed circles are included, as indicated by the line segment. This shows continuous data. That is, data where numbers between any two data values are included in the solution. If data are not continuous, they are called discrete. An example of discrete data is given later in the resource.
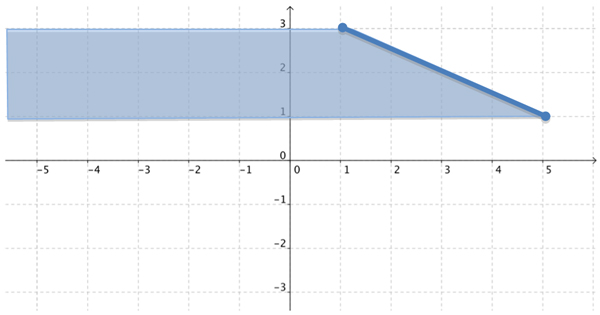
To determine the range of a function from the graph, identify the set of all the y-coordinates in the function’s graph.
In this example, the range is 1≤ y ≤ 3 since 1 is the least y-value and 3 is the greatest y-value.
Notice that the points at either end of the line segment are closed circles. This indicates that these two points are included in the solution.
Determine the domain and range of the function shown on the graph below.
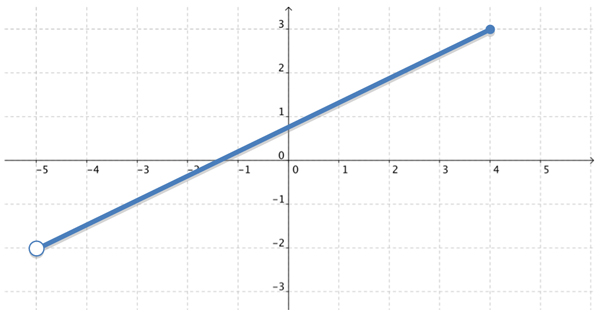
The domain is -5 < x ≤ 4 since -5 is the least x-value and 4 is the greatest x-value. The open circle on the left side of the line segment indicates that this point is not included in the solution, hence the < sign is used rather than the ≤ sign. The closed circle on the right side of the line segment indicates that this point is included in the solution; hence the ≤ sign is used rather than the < sign.
The range is -2 < y ≤ 3 since -2 is the least y-value and 3 is the greatest y-value. The open circle on the lower side of the line segment indicates that this point is not included in the solution; hence the < sign is used rather than the ≤ sign. The closed circle on the upper side of the line segment indicates that this point is included in the solution; hence the ≤ sign is used rather than the < sign.

Determine the domain and range of the function shown on the graph below.
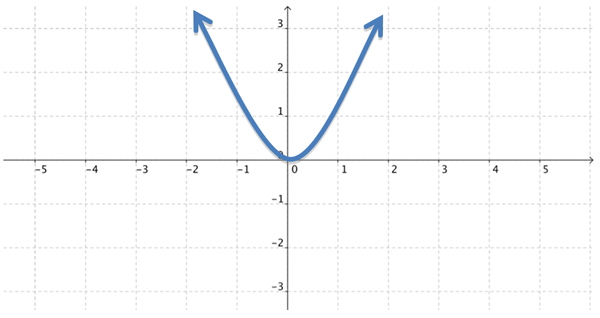
The domain is -∞ ≤ x ≤ ∞ since the set of all x-values in the graph include all real numbers. This is evident by the arrows on both the left and right sides of the graph which indicate the graph extends to the left and right indefinitely.
The range is 0 ≤ y < ∞ since the set of all y-values in the graph include those beginning at 0 and extending indefinitely, as indicated by the arrows pointing upward on the graph.