Answer the following questions in your notes.
- The quadratic parent function looks like a bowl shape that is symmetrical around the axis and starts
at (0, 0).
- Where is the quadratic parent function placed on the four quadrant graph?
-
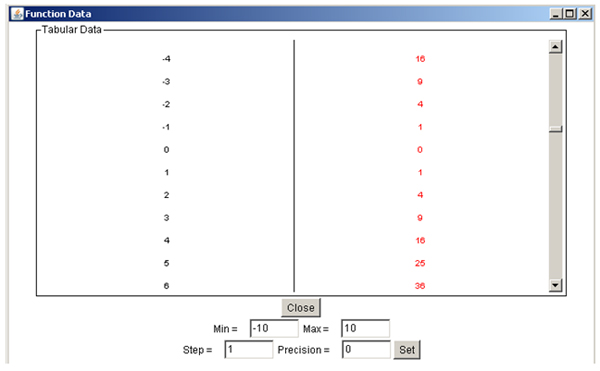
Look at the table of values for the function. Look at both positive and negative values. If using the graphing link, click on "Show Tabular Data." What do you notice about the x and y values?
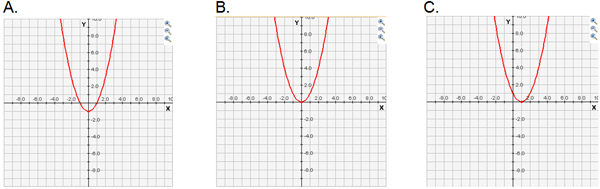
- Which graph below best represents the quadratic parent function?
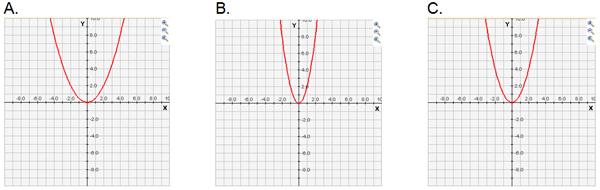
- Name three attributes that are the same about these graphs.
- Name two attributes that are different about these graphs.
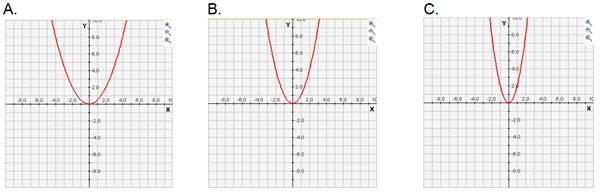
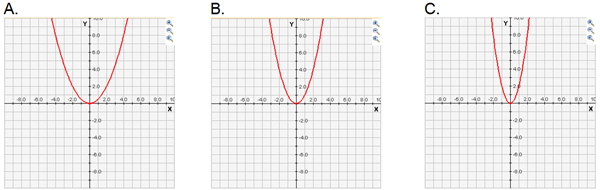
- Which graph below best represents the quadratic parent function?
- Name two attributes that are the same about these graphs.
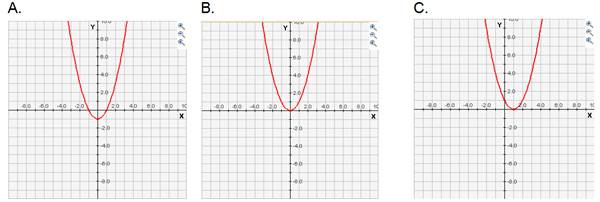
- Name two attributes that are different about these graphs.
When you are finished you can check your answers here.
-
Interactive popup. Assistance may be required.
Check Your Answer
-
Interactive popup. Assistance may be required.
Check Your Answer
-
Interactive popup. Assistance may be required.
Check Your Answer
- Interactive popup. Assistance may be required.
Check Your Answer
-
Interactive popup. Assistance may be required.
Check Your Answer
-
Interactive popup. Assistance may be required.
Check Your Answer
-
Interactive popup. Assistance may be required.
Check Your Answer
-
Interactive popup. Assistance may be required.
Check Your Answer
-
Interactive popup. Assistance may be required.
Check Your Answer
