Even the best mathematicians need ways to check their work. We’re going to use the graphing calculator to make sure we have the correct answer.
Below is a typical question related to slope-intercept.
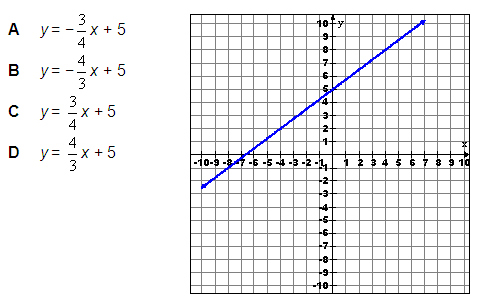
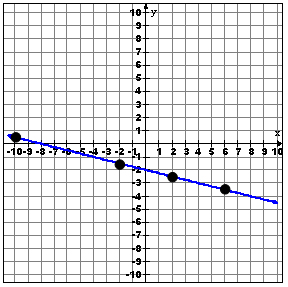
Which equation best describes the following graph?

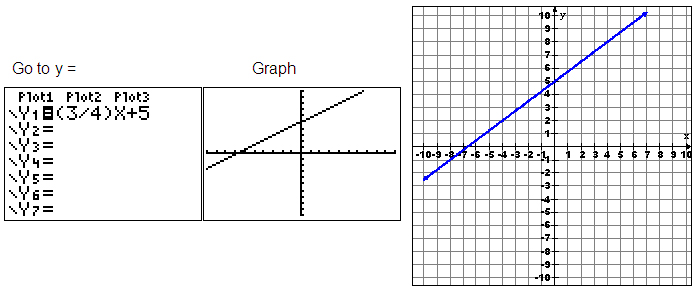
If you are not sure of the answer, you can use your calculator three different ways to double check. You should learn all three methods because there will be times when one of the methods will not be obvious.
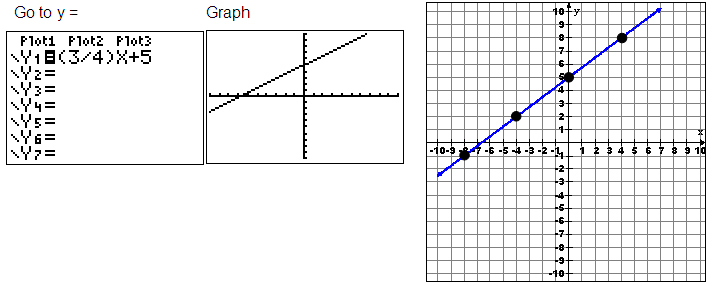
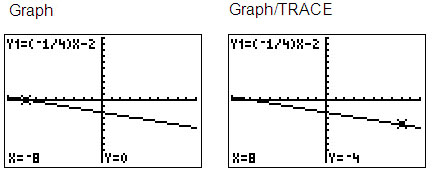
Press the TRACE button and type -4 and press ENTER.
Interactive popup. Assistance may be required.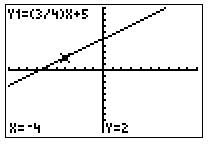
Repeating this procedure, with the graph on the calculator screen, press the TRACE button and type in - 8 and press ENTER.
Interactive popup. Assistance may be required.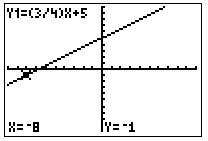
Now I’m really satisfied I got the correct answer.
Which of the following equations best describes the graph shown below? Double check your answer using all three methods.
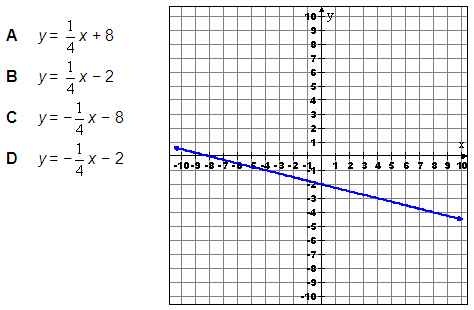
The answer is D  because the y–intercept is -2 and the line goes down 1 and right 4.
Here is how you can be 100% certain:
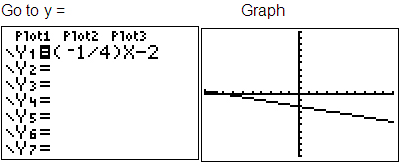
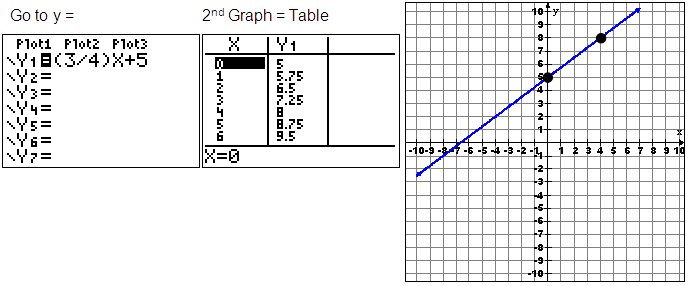
Graph is decreasing. This could be correct. Method 2: Match the graph to the table.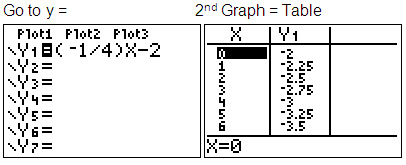 |
|
Both points (0, -2) and (4, -3) are on the graph given. I’m pretty certain.
The graph was close, the table matches points on the graph, and using the TRACE button checked two more points. I got this problem right!