Table of Values
| x | Process | y |
| -2 | 3 (-2) + 3 | -3 |
| -1 | 3 (-1) + 3 | 0 |
| 0 | 3 (0) + 3 | 3 |
| 1 | 3 (1) + 3 | 6 |
| 2 | 3 (2) + 3 | 9 |
Mapping Diagram
Ordered Pairs
(-2, -3), (-1, 0), (0, 3),
(1, 6), (2, 9)
A linear function can be represented in many formats. A table of values, a mapping diagram, and a set of ordered pairs all show essentially the same information—the relationship between each value of the independent variable, x, and the corresponding value of the dependent variable, y.
Given y = 3x – 2, the table, mapping diagram, and set of ordered pairs are shown:
| x | Process | y |
| -2 | 3 (-2) + 3 | -3 |
| -1 | 3 (-1) + 3 | 0 |
| 0 | 3 (0) + 3 | 3 |
| 1 | 3 (1) + 3 | 6 |
| 2 | 3 (2) + 3 | 9 |
(-2, -3), (-1, 0), (0, 3),
(1, 6), (2, 9)
Given the graph
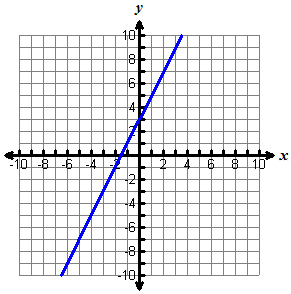
Ordered pairs are another way to represent this linear function.
 Fill in the missing coordinate by moving the correct coordinate to the correct location.
Mya’s cell phone plan charges a monthly fee of $39.95 for unlimited calling. There is an additional charge of $0.20 for each text message sent or received.
A table is one way to represent the information contained in the problem. A mapping diagram is another way and easy to create once a table is created.
Create a table and mapping table by moving the correct value to the correct location.
Write a function to represent this data by putting the information in the correct order.
Functions can be represented by tables, mapping diagrams, graphs, and equations.