To graph linear inequalities given in standard form, convert to slope-intercept form, then determine the y-intercept and the slope and graph:
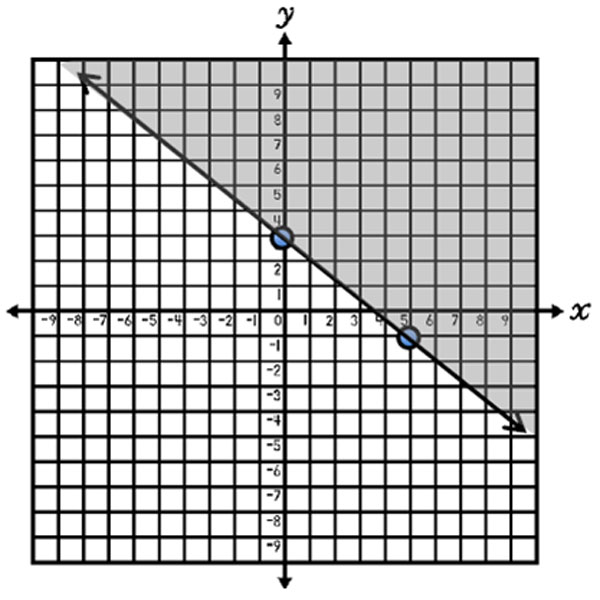
Graph 4x + 5y ≥ 15
To convert this example to slope-intercept form, subtract 4x from both sides of the inequality.
Then, divide all terms by 5.
4x + 5y ≥ 15
- 4x - 4x
5y ≥ - 4x + 15
y ≥ –
4
5
x + 3
y-intercept: 3
slope: –
4
5
In slope-intercept form, the inequality is:
y ≥ – 4 5 x + 3
Since the inequality symbol is ≥, draw a solid line and shade above the line.
| Solid Line | Dashed Line | |
| Shade Above | ≥ | > |
| Shade Below | ≤ | < |
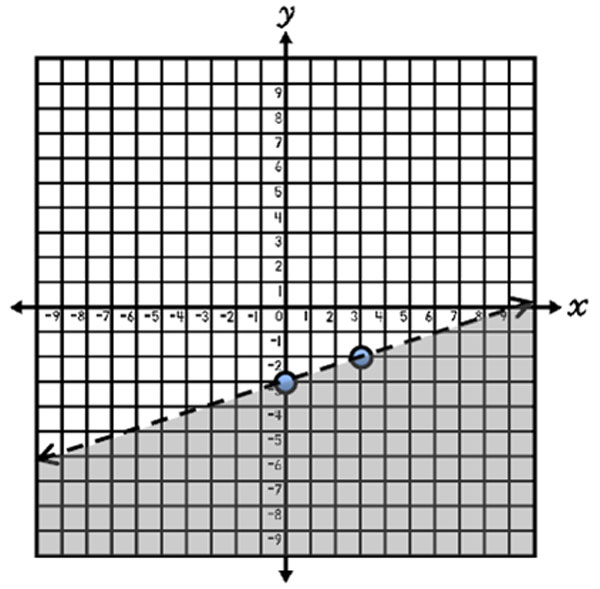
Graph x – 3y > 9.
To convert this example to slope-intercept form, subtract x from both sides of the inequality.
Then, divide all terms by -3. When an inequality is divided by a negative, the symbol changes between < and > or ≤ and ≥. In this case, the symbol changes from > to <.
x – 3y > 9
-x -x
-3y > -x + 9
y < 1 3 x – 3
y-intercept: -3
slope: 1 3
In slope-intercept form, the inequality is:
y < 1 3 x – 3
Since the inequality symbol is <, draw a dashed line and shade below the line.
| Solid Line | Dashed Line | |
| Shade Above | ≥ | > |
| Shade Below | ≤ | < |