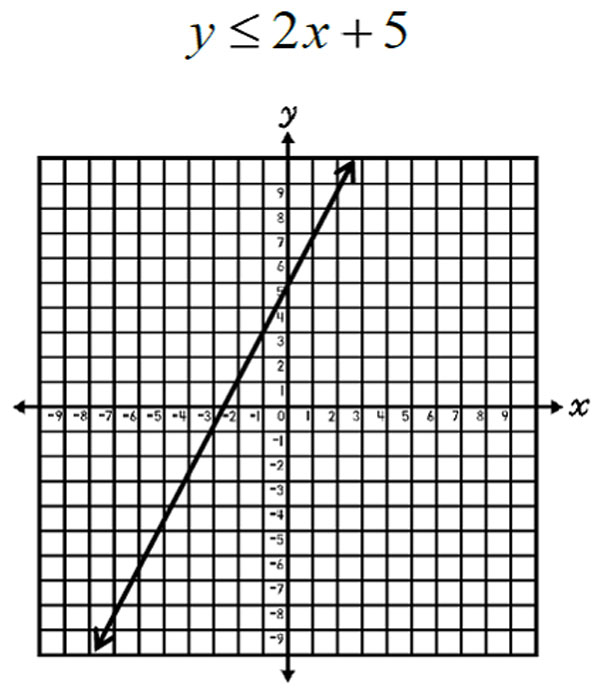
For inequalities in two variables, such as y ≤ 2x + 5, solutions are graphed on a coordinate plane.
For the inequality y ≤ 2x + 5, the solutions are graphed by drawing a solid line at (y-intercept at 5 and slope of 2). A solid line is drawn for both ≤ and ≥.
The line represents the boundary for all solutions to the inequality. To determine on which side of the line the solutions lie, select a test point.
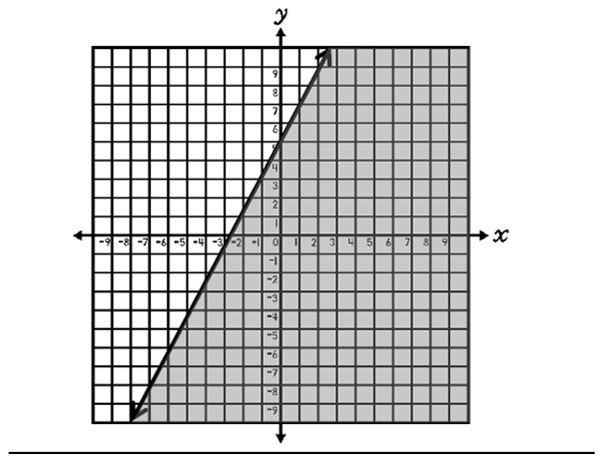
The test point should not lie on the line. The point (0, 0) can be chosen for this example.
Plug x=0 and y=0 into the inequality and simplify. If the statement is true, the point (0, 0) as well as all the other points on that side of the line are solutions to the inequality. If the statement is false, the point (0, 0) as well as all the other points on that side of the line are not solutions to the inequality.
y ≤ 2x + 5
0 ≤ 2(0) + 5
0 ≤ 0 + 5
0 ≤ 5
True!
Since (0, 0) is a solution to the inequality, shade on side of the line where (0, 0) lies (below). This indicates that all real numbers on the line and in the shaded area are solutions to the inequality.
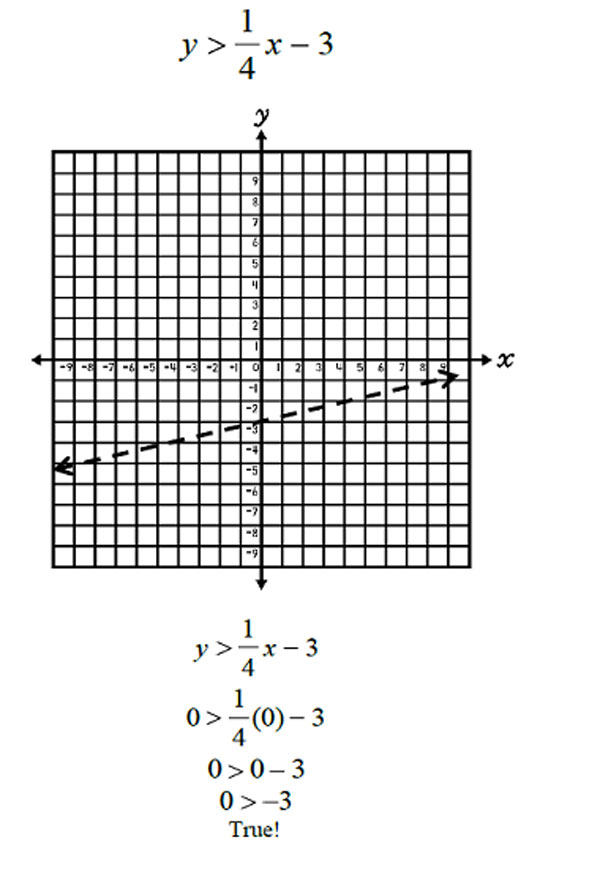
For the inequality y > 1 4 x – 3, the solutions are graphed by drawing a dashed line at y = 1 4 x - 3 (y-intercept at -3 and slope of 1 4 ). A dashed line is drawn for both < and >.
Using a test point of (0, 0), it can be determined that (0, 0) and all of the other points on that side of the line are solutions to the inequality.
Therefore, shade above the line. This indicates that all real numbers in the shaded area, but not on the line, are solutions to the inequality.