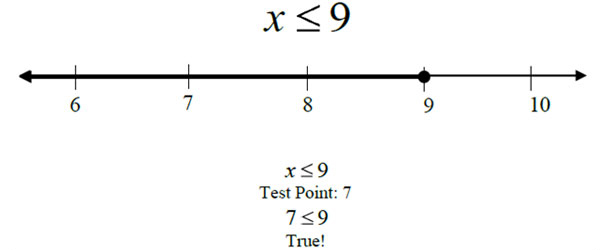
For inequalities in one variable, such as x ≤ 9, solutions are graphed on a number line.
For the inequality x ≤ 9, the solutions are graphed by drawing a closed circle at 9 and shading to the left on the number line. This indicates that all real numbers less than or equal to 9 are solutions to the inequality.
To check the shading, select a test point in the shaded area on the number line and plug it into the inequality. If the statement is true, then the shading is correct.
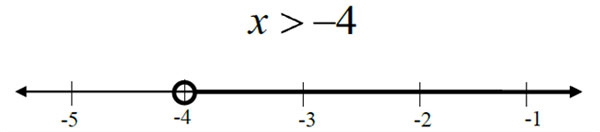
For the inequality x > -4, the solutions are graphed by drawing an open circle at -4 and shading to the right on the number line. This indicates that all real numbers greater than -4 are solutions to the inequality.
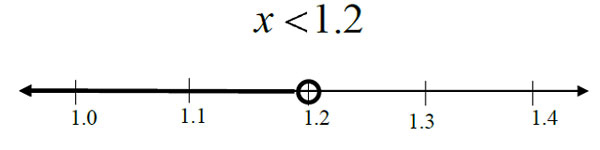
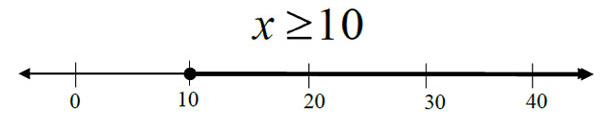
Here are some additional examples of inequalities in one variable: