Directions for graphing inequalities in two variables
To graph inequalities in two variables you must know and do the following:- Make sure the inequality is solved for y. Example: y ≤ 2 3 x + 1.
- Graph the equation of the line for the inequality.
- The line of the graph will depend on the symbol:
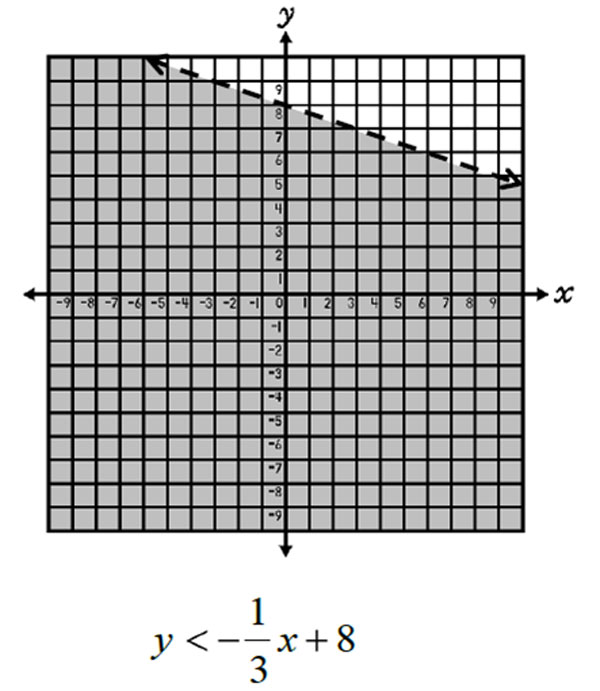
> or <
Use a dashed line with the greater or less than symbols. The ordered pairs on the dashed line are NOT a part of the solution.
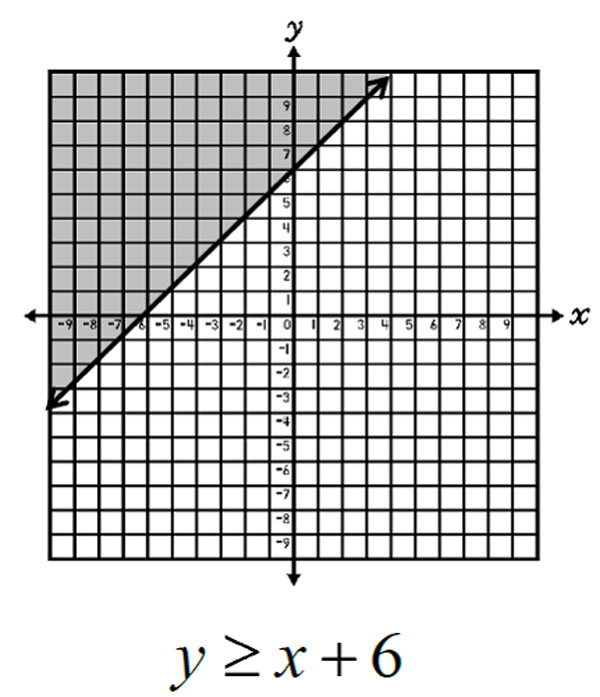
≤ or ≥
Use a solid line with the greater than or equal to or less than or equal to symbols. The ordered pairs on the solid line are a part of the solution. - Choose an ordered pair on both sides of the line.
- Substitute the ordered pair into the original inequality to determine which part or side of the line should be shaded.
- Shade the side of the graph that yields the correct solution when the ordered pair is substituted.