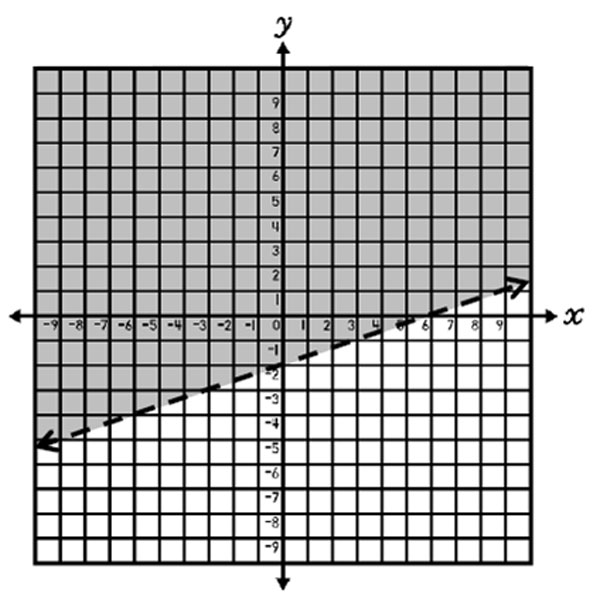
For the inequality y > 1 3 x – 2, the solutions are graphed by drawing a dashed line at y = 1 3 x – 2 (y-intercept at -2 and slope of 1 3 ) and shading above the line. This indicates that all real numbers in the shaded area, but not on the line, are solutions to the inequality.
| < | > | < | > |
| Dashed Line | Dashed Line | Solid Line | Solid Line |
A dashed line is used for inequalities, including < and >, since the solutions to the inequalities are not included on the line. For example, in the inequality y > 1 3 x – 2, the solutions are not on the line y = 1 3 x – 2, but rather above the line only. The point (0, -2), which lies on the line y = 1 3 x – 2, does not make the inequality y > 1 3 x – 2 true. So, a dashed line is drawn to indicate a boundary for the solutions.