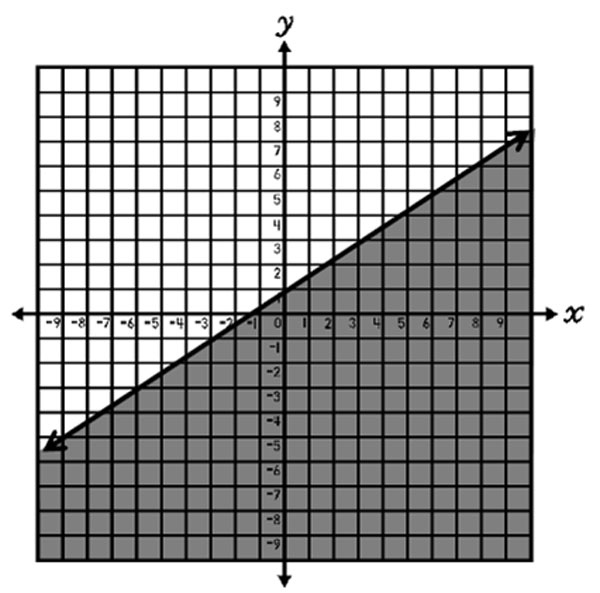
For inequalities in two variables, such as y ≤ 2 3 x + 1, solutions are graphed on a coordinate plane.
For the inequality y ≤ 2 3 x + 1, the solutions are graphed by drawing a solid line at y = 2 3 x + 1 (y-intercept at 1 and slope of 2 3 ) and shading below the line. This indicates that all real numbers on the line and in the shaded area are solutions to the inequality.
Some specific examples of solutions to the inequality include (0, 0), (8, -2), and (1, -2.5).
Keep in mind, the set of solutions to the inequality include all real numbers on the line y = 2 3 x + 1 and in the shaded area below the line.
| < | > | ≤ | ≥ |
| Dashed Line | Dashed Line | Solid Line | Solid Line |
A solid line is used for inequalities, including ≤ and ≥, since the solutions to the inequalities are included on the line. For example, in the inequality y ≤ 2 3 x + 1, the solutions are on the line y = 2 3 x + 1 as well as below this line. The point (0, 1), which lies on the line y = 2 3 x + 1, makes the inequality y ≤ 2 3 x + 1 true. So, a solid line is drawn to indicate a boundary for the solutions which includes the line itself.