A solution of an inequality is any value that makes the inequality true.
For inequalities in one variable, such as x < 2, solutions are graphed on a number line.
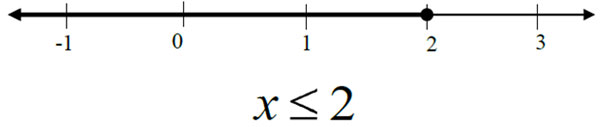
For the inequality x < 2, the solutions are graphed by drawing a closed circle at 2 and shading to the left on the number line. This indicates that all real numbers less than or equal to 2 are solutions to the inequality.
Some specific examples of solutions to the inequality include -10, -8, -1, 0, and 1. But keep in mind, the set of solutions to the inequality include all real numbers less than or equal to 2.
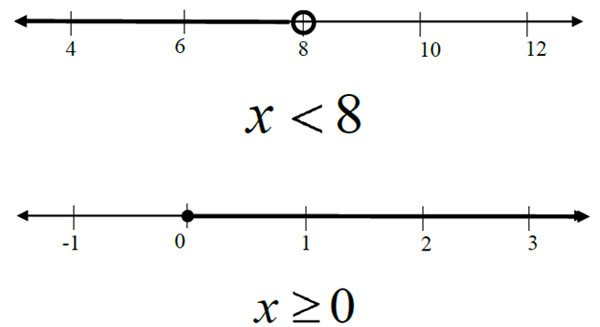
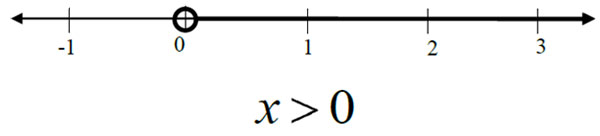
For the inequality x > 0, the solutions are graphed by drawing an open circle at 0 and shading to the right on the number line. This indicates that all real numbers greater than 0 are solutions to the inequality.
Some specific examples of solutions to the inequality include 1, 2, 3, 7, and 10.5. But keep in mind, the set of solutions to the inequality include all real numbers greater than 0.
Here are some additional examples of inequalities in one variable.