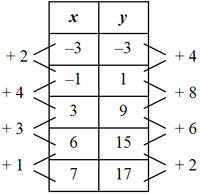
Look at a table below. There does not appear to be a constant rate of change.
In this example, we need to look at each change in the pattern of y-values and the change in the pattern of x-values.
4 2 = 2
8 4 = 2
6 3 = 2
2 1 = 2
Even though there did not appear to be a constant rate of change, there really is a constant rate of change of 2.
We're almost ready to write our equation.
We know that for our equation y = mx + b, we now know the value for m (the slope) is 2. We need to figure out what else is being done to each x-value to get the corresponding y-value.
Each x-value is multiplied by 2. What else is happening to the x-value to get the corresponding y-value?
| x | Process | y |
| -3 | 2(-3) + 3 | -3 |
| -1 | 2(-1) + 3 | 1 |
| 3 | 2(3) + 3 |
9 |
| 6 | 2(6) + 3 | 15 |
| 7 | 2(7) + 3 | 17 |
In addition to multiplying each x-value by 2, we also need to add 3 to the product in order to get the corresponding y-value.
The equation that represents this table of data is y = 2x + 3.
On your own paper, copy the table of data and determine the equation that describes the data.
| x | y |
| -6 | -3 |
| 0 | -1 |
| 3 | 0 |
| 12 | 3 |
When you have written an equation for the table, click "Check Your Answer."
Interactive popup. Assistance may be required.Answer: y = 1 3 x – 1
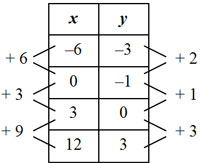
Using y = mx + b, we know that b = -1 (since this is the value of y when x = 0).
Our equation will be y = ___x – 1.
In this example, we need to look at each change in the pattern of y-values and the change in pattern of x-values.
So even though there did not appear to be a constant rate of change, we can tell that there really is a constant rate of change of 1 3 .
The equation that describes this relationship is
y =
1
3
x – 1.
