
 Writing an Equation to Describe a Table.
Click on the link below to watch the video that will show you how to write an equation when given a table of values. You will want to click on the Concept button and all the Problem buttons in order to view the entire video.
Writing an Equation to Describe a Table.
On your own paper, copy the tables of data and determine the equation that describes the data.
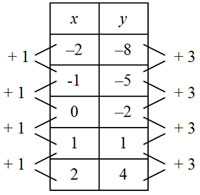
Table 1
| x | y |
| -2 | -8 |
| -1 | -5 |
| 0 | -2 |
| 1 | 1 |
| 2 | 4 |
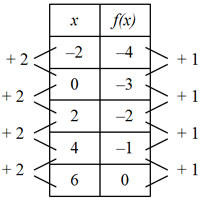
Table 2
| x | f(x) |
| -2 | -4 |
| 0 | -3 |
| 2 | -2 |
| 4 | -1 |
| 8 | 1 |
When you have written an equation for each of the tables, click "Check Your Answer."
Interactive popup. Assistance may be required.Answer for Table 1: y = 3x – 2
Answer for Table 2: y = 1 2 x – 3
Using y = mx + b, we know that b = -2 (since this is the value of y when x = 0).
Our equation will be y = ___x – 2.
Since the constant change in the y-values is 3 and the constant change in the x-values is 1, the slope is 3 1 or 3.
The equation that describes the data is
y = 3 1 x – 2 OR y = 3x – 2.
Using y = mx + b, we know that b = -3 (since this is the value of y when x = 0).
Our equation will be y = ___x – 3.
Since the constant change in the y-values is 1 and the constant change in the x-values is 2, the slope is
1 2 or 0.5
The equation that describes the data is
y = 1 2 x – 3 OR y = 0.5x – 3.
