Go to Print Free Graph Paper and print one piece of graph paper or sketch a graph on your own piece of paper to complete this activity.
Given the descriptions below, create a Speed-Time graph to represent the relationship. Remember to label each segment of the graph.
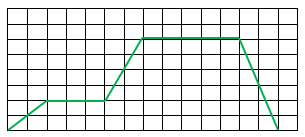
The statements below describe the motion of a car during each segment of the graph.
- Segment a: The car's speed begins at 0 and increases steadily for 2 seconds.
- Segment b: The car's speed remains constant for 3 seconds.
- Segment c: The car's speed increases more rapidly and at a steady rate for 2 seconds.
- Segment d: The car's speed remains constant for 5 seconds.
- Segment e: The car's speed decreases rapidly for 2 seconds until the car returns to a speed of 0.
Interactive popup. Assistance may be required.
See a possible answer here.