Source: reidab, Flickr
Source: reidab, Flickr
If the relationship given does not include specific values, determine the shape of the graph and estimate the placement on the coordinate plane.
For example, in the relationship between the temperature of a cup of hot cocoa as time passes, specific values are not given.
First, determine the independent and dependent quantities.
In the hot cocoa example, the independent quantity is the time that has elapsed since the hot cocoa is poured, and the dependent quantity is the temperature of the hot cocoa.
Another way to state the relationship is, "As time passes, the temperature of the hot cocoa decreases then remains constant."
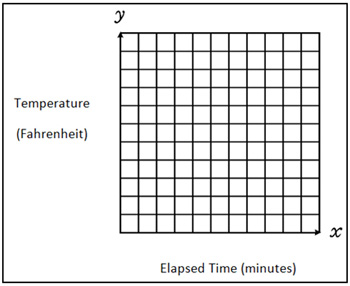
The next step is to label your axes with the independent and dependent quantities.
The x-axis is always labeled with the independent quantity, and the y-axis is always labeled with the dependent quantity.
So, in the hot cocoa example, Elapsed Time is labeled on the x-axis and Temperature is labeled on the y-axis.
When time is the independent quantity, the y-intercept is the starting point.
In the hot cocoa example, since specific values are not given, the axes are not labeled .
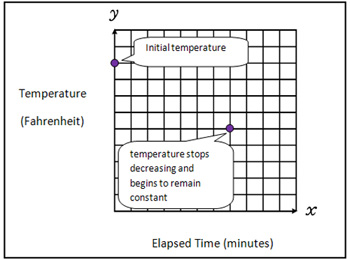
Since the exact y-intercept cannot be determined, estimate the initial temperature. This is the y-intercept.
In addition, the point at which the temperature stops decreasing cannot be determined either. So, estimate the point at which the temperature stops decreasing and begins to remain constant.
There is no x-intercept in the hot cocoa example since the temperature never reaches 0 degrees Fahrenheit.
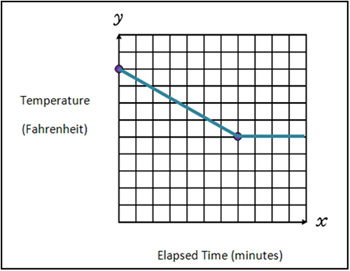
Since the temperature of the hot cocoa decreases at a constant rate, this would indicate a linear relationship. Connect the y-intercept and the other point.
Then, draw a horizontal line segment indicating the temperature remains constant after this point.