
Source: Maciej Toporowicz, NYC
Source: Maciej Toporowicz, NYC
To create a graph to describe a given verbal relationship, the first step is to determine the independent and dependent quantities. For example, in the relationship between the height of a candle as it burns and the time that has elapsed, the independent quantity is elapsed time and the dependent quantity is the height of the candle. Another way to state the relationship is as time passes, the height of the candle decreases.
The next step is to label your axes with the independent and dependent quantities. The x-axis is always labeled with the independent quantity and the y-axis is always labeled with the dependent quantity. So, in the candle example, Elapsed Time is labeled on the x-axis and Height of Candle is labeled on the y-axis.
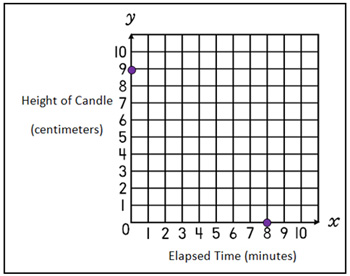
When time is the independent quantity, the y-intercept is the starting point. In the candle example, if the candle started at a height of 9 cm, the y-intercept is 9. If the height of the candle reaches 0 cm after 8 minutes, the x-intercept is 8.
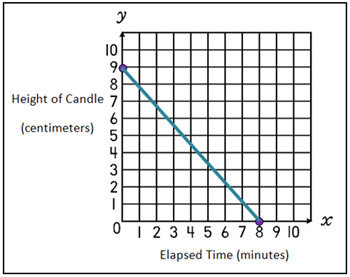
Since the candle burns at a constant rate, this would indicate a linear relationship. Connect the points of the y-intercept and x-intercept.