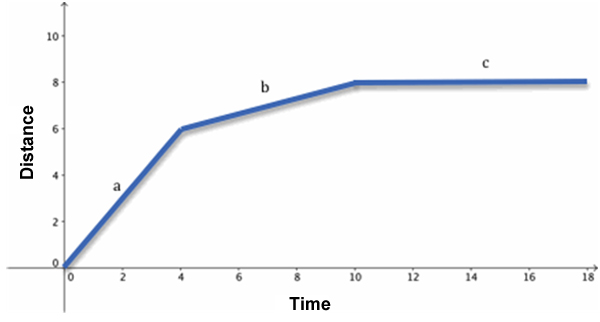
Consider the graph below:

Graph of the relationship between time (x) and distance (y). Line section a rises at a 45 degree angle until x = 4 and y = 6.  Line section b rises at about a 15 degree angle until x = 10 and y = 8.  Line section c does not change values of y with respect to x.

The graph represents the relationship between the distance (in meters) traveled by a fish as it swims downstream from a fork in the river and the time (in minutes) that it has been swimming.

Write statements in your notes to describe each segment of the graph. Check your work below:

Interactive popup. Assistance may be required.

Segment a

The fish begins at the fork in the river and swims at a constant pace for four minutes. The fish travels a distance of six meters during this time. Close Pop Up
Interactive popup. Assistance may be required.

Segment b

During the next six minutes, the fish swims two meters at a constant, but slower, pace.Close Pop Up
Interactive popup. Assistance may be required.

Segment c

The fish stops swimming and remains at a distance of eight meters from the fork in the river.Close Pop Up