Now that you have completed the Flowing Through Mathematics activity, let's apply what you have learned to write a verbal description of a graph that contains several different segments.
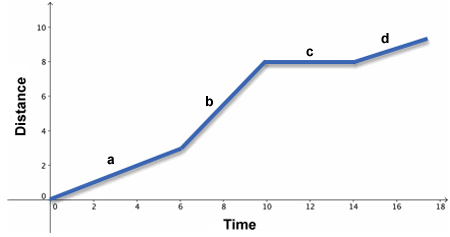
The graph below shows the relationship between time (in minutes) and distance traveled (in miles) of a car. The independent quantity is time and the dependent quantity is distance.
To describe the relationship between time and distance in this graph, consider the graph in segments.
First, segment a is increasing, or slanted up to the right. This shows that the car's distance is increasing, or getting larger.
Interactive popup. Assistance may be required. Since a is a line segment, the car is traveling at a constant rate during this time period. Notice that the y-intercept of this line segment is at the origin. This shows that the initial distance of the car is 0. In other words, the car is starting at position 0. The end of line segment a is at (6, 3). This means that the car traveled 3 miles in 6 minutes.
Second, notice segment b. This portion of the graph is also increasing, or slanted up to the right. This shows that the car's distance is increasing, or getting larger.
Third, notice segment c. This portion of the graph is a horizontal line segment, or the distance is not changing.
Finally, notice segment d. This portion of the graph is again increasing, or slanted up to the right.
To describe the graph, narrate the graph like a story:
A car travels a distance of 10 miles in 18 minutes. During that time, the car travels at a steady rate for 6 minutes, then increases its speed dramatically for 4 minutes. The car then stops for 4 minutes before it returns to its original pace for the final 4 minutes.