What about equations of lines that are not in slope–intercept form?
To review how to change equations into slope–intercept form, do as many of the following as necessary.
Review the steps of changing an equation from standard form to slope-intercept form.
Watch the following video on how to convert an equation to slope-intercept form.
Source: Converting to slope-intercdept form, KhanAcademy, You Tube
Self test. Match the equation of a line in standard form to a sketch of its graph. Follow the link below and answer the problems found on that page using your notes.
Example: Which graph best represents the equation 4x + 5y = 6?
Use your notes to change the equation to slope-intercept form. Then find the graph that matches the equation.
Scroll through the answer choices and ways to double check so you know you're right.
How did you find the matching graph? First, you want to solve for y.
View the steps in the presentation below:
4x + 5y = 6 is equivalent to y = – 45x + 65
What did you find out about the graphs?
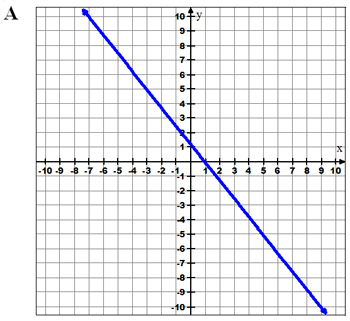
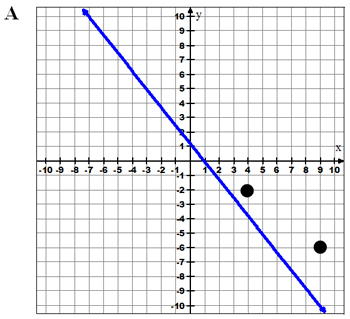
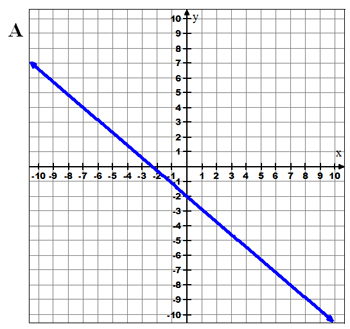
A is incorrect for two reasons.
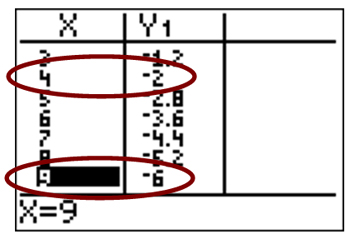
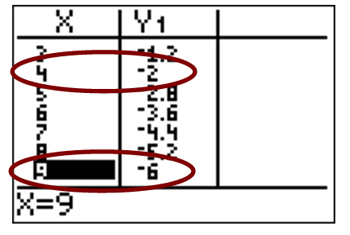
Using y = - 45x + 65the TABLE shows that the points (4, -2) and (9, -6) ought to be on the graph. These points are plotted on the graph but are not on the line.
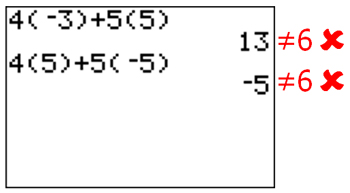
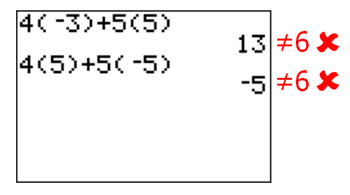
Points given on the graph do not satisfy the equation 4x + 5y = 6. (-3, 5) and (5, -5) are points on the line graphed above. But when substituted into 4x + 5y = 6 these points do not give true statements.
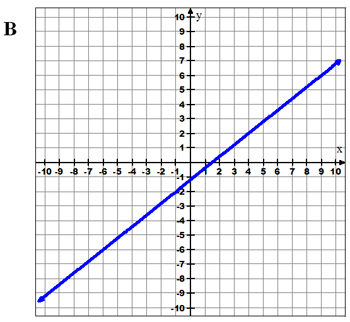
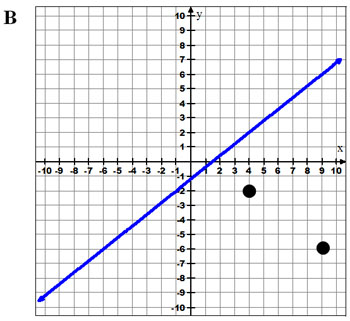
B is incorrect for four reasons.
Using y = - 45x + 65, the slope should be negative.
Using y = - 45x + 65, the y-intercept should be positive 1.2. The y-intercept in the graph is negative.
Using y = - 45x + 65, the TABLE shows that the points (4, -2) and (9, -6) ought to be on the graph. These points are plotted on the graph but are not on the line.
Points given on the graph do not satisfy the equation 4x + 5y = 6. (-3, 5) and (5, -5) are points on the line graphed above but when substituted into 4x + 5y = 6 do not give true statements.
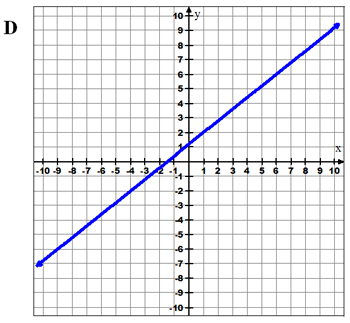
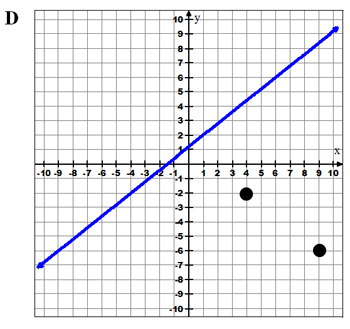
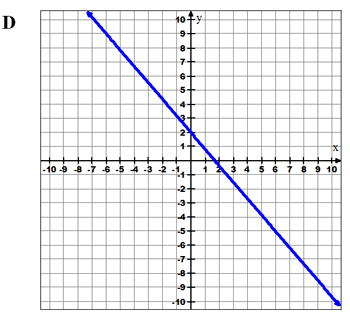
D is incorrect for three reasons.
Using y = - 45x + 65, the slope should be negative.
Using y = - 45x + 65, the TABLE shows that the points (4, -2) and (9, -6) ought to be on the graph. These points are plotted on the graph but are not on the line.
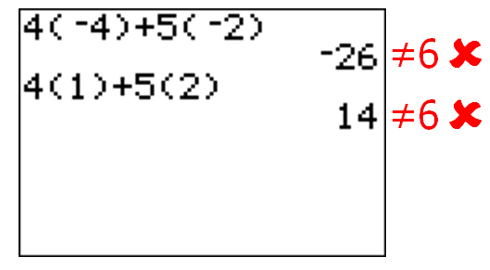
Points given on the graph to not satisfy the equation 4x + 5y = 6. (-4, -2) and (1, 2) are points on the line graphed above, but when substituted into 4x + 5y = 6, do not give true statements.
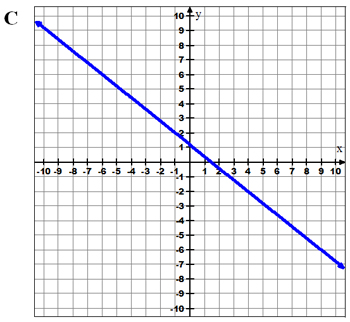
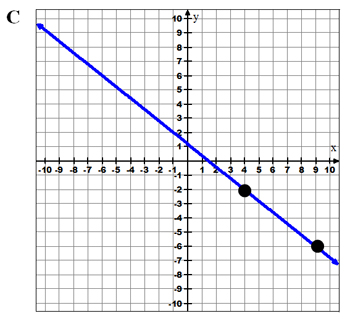
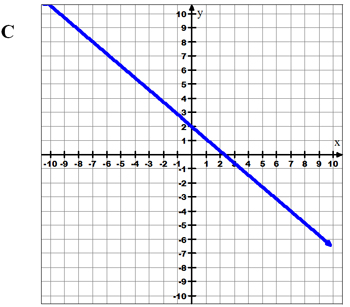
C is correct for two reasons.
Using y = – 45x + 65 the TABLE shows that the points (4, -2) and (9, -6) should be on the graph and they are there.
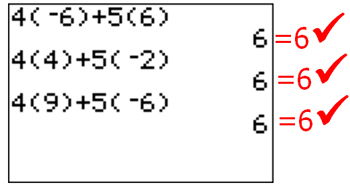
Points given on the graph satisfy the equation 4x + 5y = 6. (–6, 6), (4, –2), and (9, –6) are all on the graph above.
This is definitely C. Using the calculator has confirmed it is correct. One question closer to passing!
Now try the following:
Which graph best represents the equation 7x + 6y = -12 ?
Pick the correct answer and record the answer in your notes.
Scroll down to see which graph is right and why the others are wrong.
7x + 6y = -12 is equivalent to y = – 76x − 2
A is incorrect for two reasons. B is correct! C is incorrect for three reasons. D is incorrect for three reasons.


 Watch the following video on how to convert an equation to slope-intercept form.