Now that you have practiced making a graph match an equation, you can practice matching an equation to a graph.
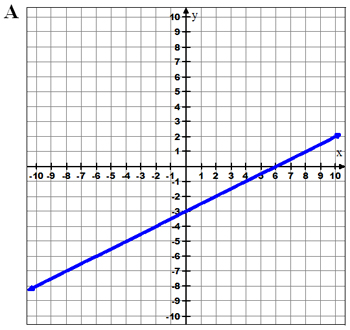
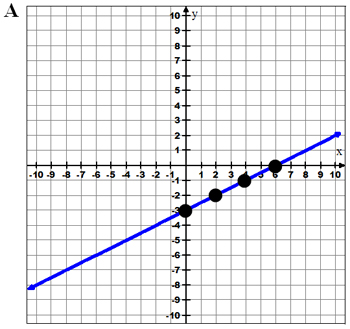
Example 1: Look at these graphs and decide which graph best represents the equation y = 1 2 x − 3.
|
|
|
|
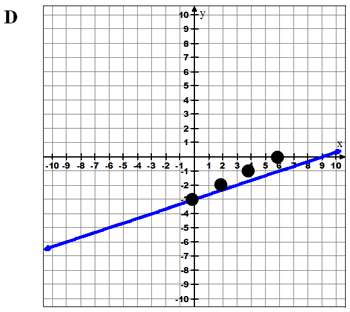
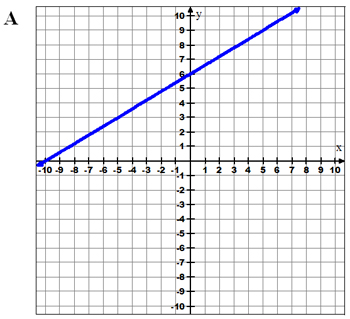
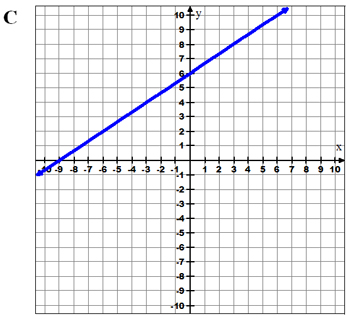
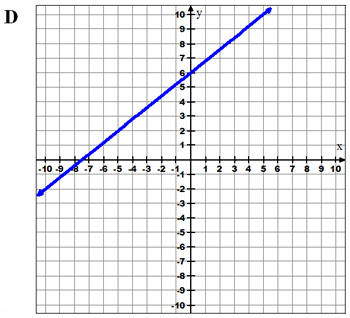
The correct graph is the one that has a y-intercept of -3 and a slope of 1 2 .
The graph in answer choice A has a y-intercept at (0, -3). From (0, -3) the graph increases 1 space and moves 2 to the right. A is correct.
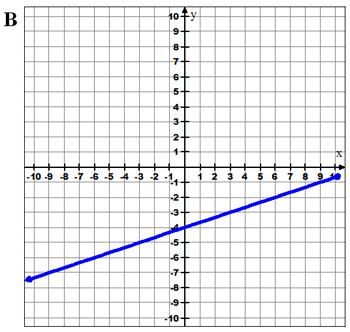
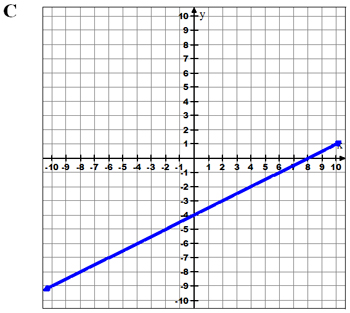
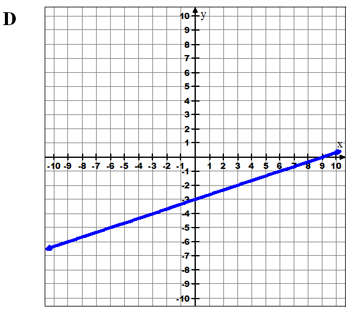
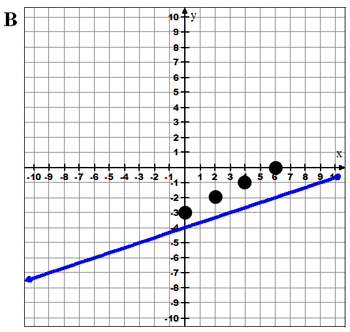
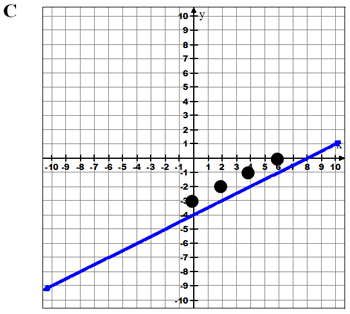
Why are B, C, and D not correct? What are the y-intercepts and slopes of these graphs?
Use your notes to record the y-intercepts and slopes of graphs B, C, and D.
Once you have an answer, it is always good to double check. Using a graphing calculator, input the equation into Y = and open the TABLE.
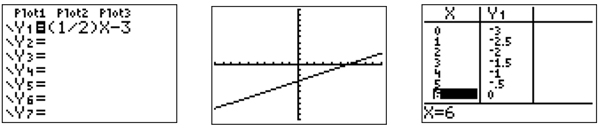
The correct graph ought to have the points (0, -3), (2, -2), (4, -1), and (6, 0).
Again, A appears to be the correct answer! One more question correct!
 |
 |
 |
 |
Let’s try another equation.
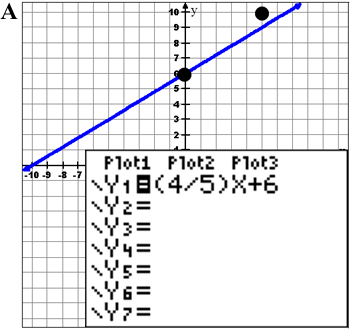
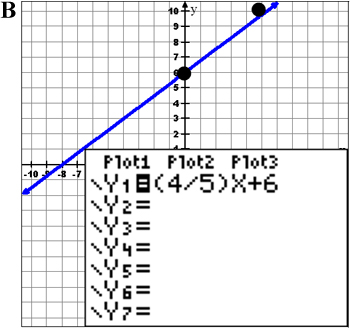
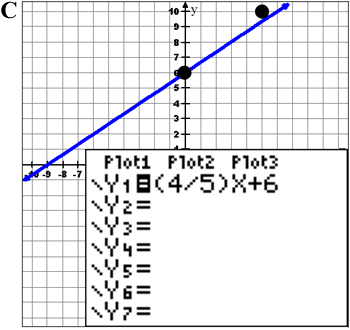
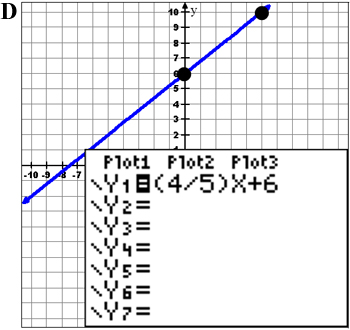
Example 2: Which graph best represents the equation y = 4 5 x + 6?
What is the slope and what is the y-intercept of this equation?
Decide which answer you’d pick before checking your answer.
 |
 |
 |
 |
 Now graph the equation on your graphing calculator and check to see if any of the graphs shown match the picture on your calculator screen. Also, use points in the table to find if the graph matches.
Move your mouse over the calculator image of the equation below to check your answer.
Now graph the equation on your graphing calculator and check to see if any of the graphs shown match the picture on your calculator screen. Also, use points in the table to find if the graph matches.
Move your mouse over the calculator image of the equation below to check your answer.
|
|
|
|